
IR Spectroscopy
Infrared (IR) spectroscopy measures how molecules absorb infrared light, which causes bonds to vibrate more vigorously. Each bond has a characteristic vibration frequency depending on bond strength and atomic masses. A peak at that frequency in the IR spectrum = that bond is present.
Wavenumbers
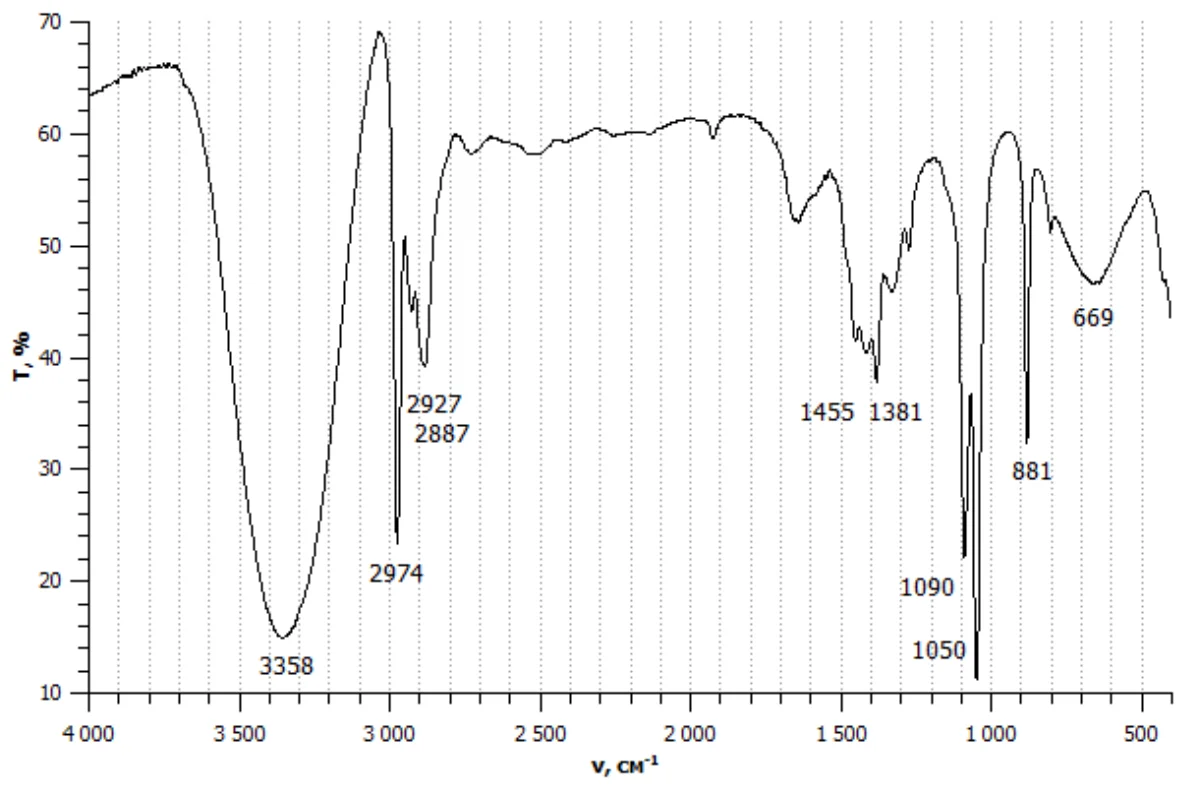
IR spectra are plotted with wavenumber on the x-axis (in cm⁻¹, inverse wavelengths) and percent transmittance on the y-axis. Wavenumber and frequency are proportional: higher wavenumber = higher frequency = higher energy photon.
Typical IR range: 4000 to 400 cm⁻¹.
- High wavenumber (3000-4000 cm⁻¹): O-H, N-H, C-H stretches. Strong bonds involving hydrogen.
- Medium wavenumber (1500-2500 cm⁻¹): C=O, C≡C, C≡N stretches. Double and triple bonds.
- Low wavenumber (400-1500 cm⁻¹): C-C, C-O, C-N single bonds. The “fingerprint region” - complex and hard to interpret but unique to each molecule.
What Affects Vibration Frequency
The classic Hooke’s law analogy: a bond is like a spring connecting two masses.
- Stronger bonds vibrate faster (higher wavenumber). C≡C (~2100 cm⁻¹) > C=C (~1650 cm⁻¹) > C-C (~1000 cm⁻¹).
- Lighter atoms vibrate faster. C-H (~3000) > C-C (~1000) because H is much lighter.
- Higher bond order = stiffer spring = higher frequency. This is the same trend as stronger bonds.
Triple bonds come at ~2100-2300 cm⁻¹. Double bonds at ~1650-1750 cm⁻¹. Single bonds below 1500 cm⁻¹.
Why Not Every Vibration Shows Up
A vibration appears in the IR spectrum only if it changes the molecule’s dipole moment. Completely symmetric molecules (like Cl-Cl or O=O) do not show IR signals because the vibration does not change the dipole - there is no dipole to change.
Polar bonds (C=O, O-H, C-H in C-H next to electronegative atoms) give strong IR peaks. Nonpolar vibrations (C-H in alkane, C=C in symmetric alkenes) give weaker or no IR peaks.
Compare with NMR, which detects nuclei, not dipole changes - nearly every H and C shows up in NMR.
Peak Shape and Intensity
IR peaks vary in shape:
- O-H stretches are BROAD (3200-3500 cm⁻¹) due to hydrogen bonding between molecules. A very broad OH peak is often the telltale sign of an alcohol or carboxylic acid.
- Carboxylic acid O-H is exceptionally broad (2500-3300 cm⁻¹) because of dimer H-bonding.
- N-H stretches are moderately broad. Primary amines show two peaks (symmetric and asymmetric stretches); secondary amines show one. Tertiary amines have NO N-H and thus no N-H peak.
- C=O stretches are SHARP and STRONG (one of the most distinctive IR peaks). Position varies with derivative: aldehyde ~1725, ketone ~1715, ester ~1735, acid ~1710 (in dimer), amide ~1680.
Specific C=O Wavenumber Shifts
Carbonyl stretches shift with the groups attached:
| Carbonyl type | C=O stretch (cm⁻¹) | Note |
|---|---|---|
| Acyl chloride | 1800 | High - strong withdrawal |
| Anhydride | 1760, 1820 (two peaks) | Strong withdrawal |
| Ester | 1735 | |
| Aldehyde | 1725 | |
| Ketone | 1715 | |
| Carboxylic acid | 1710 | With H-bonding |
| Amide | 1660-1690 | Lower due to N resonance donation |
| Conjugated carbonyl | ~50 cm⁻¹ lower | Conjugation weakens C=O |
These shifts reflect the degree of resonance donation from the attached group into the C=O. More donation = weaker C=O double bond = lower stretching frequency.
Interpretation Strategy
- Look at 3000-3500 cm⁻¹: broad OH? sharp N-H? sp² C-H (above 3000) or sp³ C-H (below 3000)?
- Look at 1700 region: sharp strong peak = C=O. Note exact position to identify the type.
- Look at 2100-2300: peak = triple bond (C≡C, C≡N).
- Fingerprint region (below 1500): complex - rarely the first place to look, but can confirm suspected groups.
Most MCAT IR questions focus on recognizing the top 3 patterns: broad OH, sharp C=O, and N-H.