
Evaluating Scientific Claims
A news article claims that a single study “proves” red wine prevents cancer. A supplement company cites “published research” showing their product boosts memory by 300%. A viral social media post links a journal paper as evidence that a common food is toxic. In each case, the claim sounds scientific. But the MCAT trains you to look behind the curtain: Was the study peer-reviewed? Has it been replicated? Is the effect statistically significant and practically meaningful? Does the journal even have editorial standards?
Evaluating scientific claims is the capstone skill of this chapter. Everything you have learned about study design, variables, controls, validity, and bias converges here. The MCAT presents passages from real or realistic research studies, and your job is to assess the quality of the evidence and the strength of the conclusions.
Peer Review
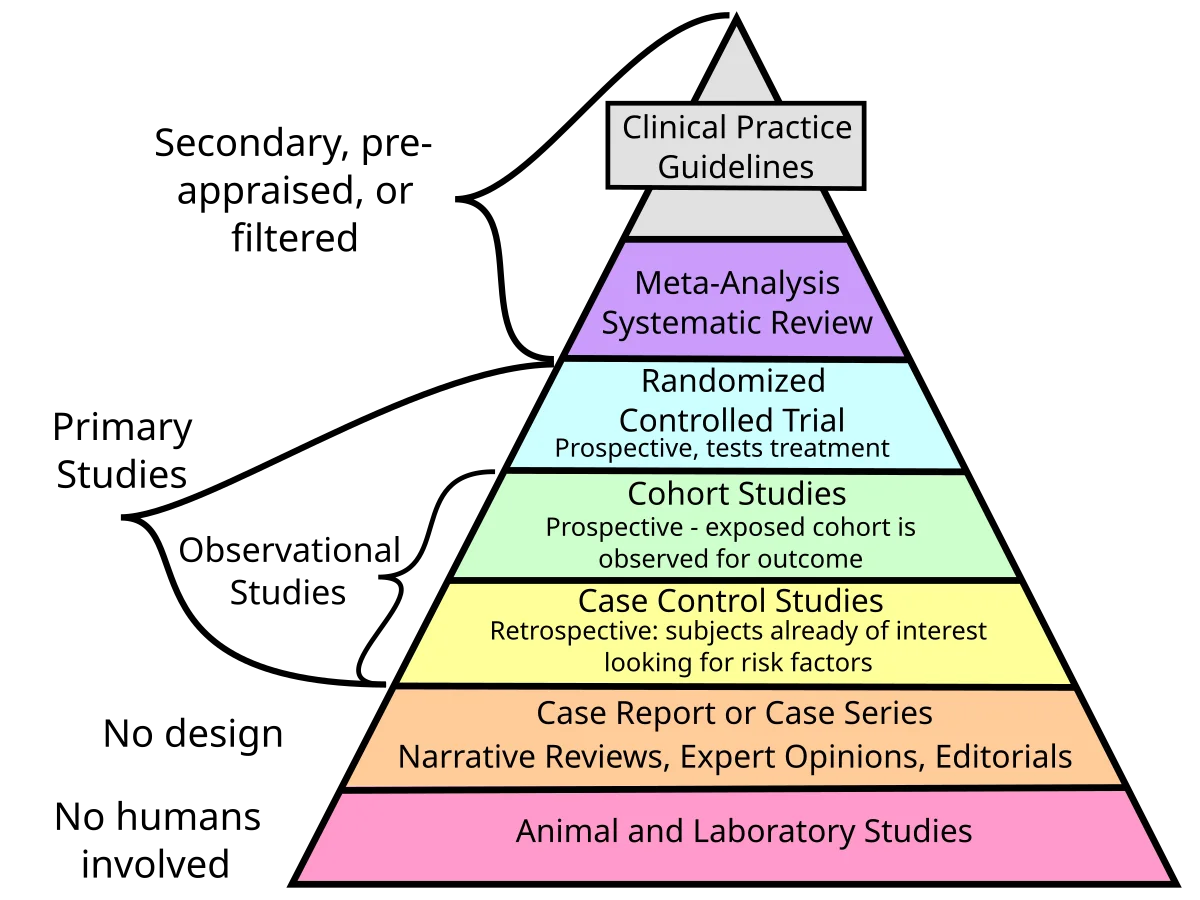
Peer review is the process by which other experts in the field evaluate a study’s methods, analysis, and conclusions before it is published in a journal.
How it works: A researcher submits a manuscript to a journal. The editor sends it to two or three independent experts (peers) who were not involved in the study. The reviewers critique the methodology, point out flaws, and recommend whether to accept, revise, or reject the paper. The process is usually anonymous (the reviewers do not know the authors, or vice versa, depending on the journal).
Why it matters: Peer review is the primary quality filter in science. It is not perfect - reviewers can miss errors, hold biases, or be slow - but it is far better than no review at all. A peer-reviewed study has at least been scrutinized by experts, which gives it more credibility than a non-reviewed preprint, blog post, or press release.
Replication and Reproducibility
Replication means running the same study again (ideally by a different research team) to see if the results hold up. A finding that cannot be replicated is far less trustworthy than one confirmed by multiple independent groups.
Reproducibility is a related but slightly different concept: can another researcher, given the same data and methods, arrive at the same conclusions? Reproducibility is about the analysis; replication is about the entire experiment.
The replication crisis refers to the widespread finding that many published results - particularly in psychology and biomedical science - fail to replicate when other teams attempt to repeat them. This has raised awareness about the importance of larger sample sizes, preregistration, and transparent reporting.
Statistical Significance vs. Practical Significance
Statistical significance means the result is unlikely to have happened by chance alone. The conventional threshold is p < 0.05, meaning there is less than a 5% probability of observing this result if the null hypothesis were true.
Practical significance (also called clinical significance) means the result is large enough to matter in the real world.
These two can diverge:
- Statistically significant but not practically significant: A study with 100,000 participants finds that a new drug lowers blood pressure by 0.5 mmHg (p < 0.001). The result is real (not due to chance) but clinically meaningless - no doctor would prescribe a drug for half a millimeter of mercury.
- Practically significant but not statistically significant: A study with 15 participants finds that a drug lowers blood pressure by 20 mmHg (p = 0.08). The effect size is huge, but the small sample size means the study lacks the statistical power to reach p < 0.05.
Effect Size
Effect size measures how big the difference between groups is, independent of sample size. Common measures include Cohen’s d (for comparing two means) and the correlation coefficient r.
Effect size matters because p-values are heavily influenced by sample size. A trivially small effect can reach p < 0.05 with a large enough sample. Effect size tells you how big the difference is, not just whether it exists.
Limitations Sections
Every well-written study includes a limitations section that honestly acknowledges weaknesses. Common limitations include:
- Small sample size (reduces statistical power)
- Non-representative sample (reduces external validity)
- Reliance on self-report data (subject to response bias)
- Short follow-up period (may miss long-term effects)
- Lack of blinding or randomization (reduces internal validity)
On the MCAT, passages sometimes include a study’s limitations. Questions may ask you to identify additional limitations the authors did not mention, or to evaluate whether a stated limitation actually affects the conclusions.
Publication Bias
Publication bias (also called the file-drawer problem) happens because studies with positive, statistically significant results are much more likely to be published than studies with null or negative results. The studies that “did not work” sit in file drawers, unpublished.
This creates a distorted picture of reality. If 20 teams independently test a drug and 19 find no effect but 1 finds a positive result (by chance), only the positive result gets published. Anyone reading the literature sees 100% positive evidence, when in reality the drug probably does not work.
Strategies to combat publication bias:
- Preregistration: Researchers publicly register their hypothesis and methods before collecting data, making it harder to hide null results
- Registered reports: Journals agree to publish the study based on its design, regardless of results
- Meta-analyses: Statistical methods that combine results from multiple studies, sometimes including unpublished data
How to Read an Abstract on the MCAT
MCAT science passages often resemble research paper abstracts. Here is how to read them efficiently:
- Identify the research question. What are they trying to find out?
- Classify the study type. Experimental? Observational? Which subtype?
- Identify the variables. What is the IV? DV? Were confounders controlled?
- Evaluate the design. Controls? Blinding? Sample size? Randomization?
- Assess the conclusion. Does it follow from the data? Does it overextend?
You do not need to understand every detail of the methods. Focus on the elements this chapter has taught you: variables, controls, design type, bias risks, and whether the conclusion is supported.