A new blood pressure drug is tested in 200,000 patients. It lowers systolic blood pressure by 0.5 mmHg compared to placebo, with p = 0.001. The result is statistically significant. Should doctors prescribe it? Absolutely not. A 0.5 mmHg reduction is clinically meaningless - you would not even notice it on a blood pressure cuff. This study perfectly illustrates the most important concept in this entire chapter: statistical significance does not mean the result matters.
Statistical Significance vs. Clinical Significance
Statistical significance (p < 0.05) tells you the result is unlikely to be due to chance alone. It says nothing about the size or importance of the effect.
Clinical significance (or practical significance) asks: is the effect large enough to actually matter in the real world?
Effect Size
Effect size quantifies the magnitude of a difference, independent of sample size. While p-values shrink as sample size grows (even for tiny effects), effect size stays constant.
Cohen’s d
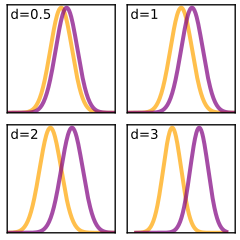
Effect size visualized with Cohen's d. At d = 0.2 (small effect), the two distributions nearly overlap completely. At d = 0.5 (medium), noticeable separation appears. At d = 0.8 (large), the distributions are substantially separated. Effect size captures the practical magnitude of a difference, independent of sample size. Credit: Wikimedia Commons, CC BY-SA 3.0
Cohen’s d is the most commonly referenced effect size measure. It expresses the difference between two group means in units of standard deviations.
d = (Mean1 - Mean2) / pooled SD
Cohen’s benchmarks:
d = 0.2: Small effect
d = 0.5: Medium effect
d = 0.8: Large effect
A drug that lowers blood pressure by 0.5 mmHg when the SD of blood pressure is 15 mmHg has d = 150.5 = 0.03 - a negligibly small effect, no matter how small the p-value.
A therapy that improves depression scores by 8 points on a scale with SD = 10 has d = 0.8 - a large, clinically meaningful effect.
SD vs. SEM: Two Very Different Error Measures
This distinction is tested directly on the MCAT and is crucial for interpreting graphs with error bars.
Standard Deviation (SD)
SD measures the spread of individual data points around the mean. It tells you how variable the raw data is.
SD answers: “How spread out are individual measurements?”
Standard Error of the Mean (SEM)
SEM measures the precision of the sample mean as an estimate of the population mean. It is calculated as:
SEM = SD / sqrt(n)
SEM is always smaller than SD (because you divide by sqrt(n)). As sample size increases, SEM decreases, meaning the estimate of the mean becomes more precise.
SEM answers: “How precisely do we know the true mean?”
Error Bars: Check the Label
Error bars on graphs can represent SD, SEM, or 95% confidence intervals. The interpretation changes a lot depending on which is used.
SD error bars: Show the spread of the data. About 68% of data points fall within one SD bar above and below the mean.
SEM error bars: Show the precision of the mean estimate. They are much smaller than SD bars and can make differences look more impressive.
95% CI error bars: If the error bars of two groups do not overlap, the difference is statistically significant. (Note: slight overlap does not necessarily mean non-significance.)
Putting It All Together
When you encounter a research result on the MCAT, evaluate it on three dimensions:
Statistical significance: Is p < 0.05? If not, the result may be due to chance.
Effect size: Is the difference large enough to matter? Use Cohen’s d benchmarks.
Precision: How wide is the confidence interval? Wide CIs suggest the true effect could be much larger or smaller than reported.
A well-designed, high-quality study has all three: a significant p-value, a meaningful effect size, and a narrow confidence interval.
A study of 500,000 people finds that eating chocolate is associated with a 0.1-point increase in happiness score (on a 100-point scale), with p = 0.0002. Should we conclude that chocolate meaningfully improves happiness?
Click to reveal answer
No. While the result is statistically significant (p = 0.0002), the effect size is trivially small - a 0.1-point change on a 100-point scale is clinically meaningless. The tiny p-value was achieved because of the enormous sample size (500,000), not because of a large effect. This is a textbook example of statistical significance without practical significance.
A graph shows two treatment groups with very small error bars that do not overlap. Before concluding the groups are different, what should you check about those error bars?
Click to reveal answer
Check whether the error bars represent SD, SEM, or 95% CI. If they represent SEM, the bars are artificially small (SEM = SD/sqrt(n)), and the apparent separation may be less impressive than it looks. SEM bars shrink with increasing sample size, so two groups could have widely overlapping SD bars but non-overlapping SEM bars. The type of error bar completely changes the interpretation of the visual difference.