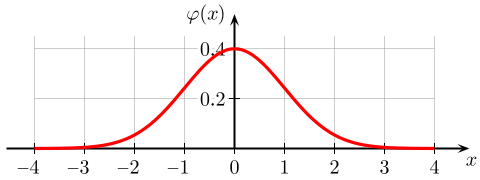
Your professor announces that the exam will be “graded on a curve.” What does that actually mean? It means the raw scores will be mapped onto a normal distribution - the famous bell-shaped curve where most students cluster around the average and fewer students appear at the extremes. This single shape turns up everywhere: heights of adults, blood pressure readings, measurement errors in a lab, IQ scores. Understanding its properties is essential for nearly every statistics question on the MCAT.
What Makes a Distribution “Normal”?
A normal distribution has several defining features:
Bell-shaped and symmetric around the mean. The left half is a mirror image of the right half.
Mean = Median = Mode. All three measures of central tendency sit at the center.
Tails extend infinitely in both directions but never touch the x-axis. Extreme values are possible but increasingly rare.
Completely defined by two numbers: the mean (which sets the center) and the standard deviation (which sets the width).
The 68-95-99.7 Rule (Empirical Rule)
The normal distribution (bell curve) with the 68-95-99.7 empirical rule. About 68% of data falls within 1 SD of the mean, 95% within 2 SDs, and 99.7% within 3 SDs. The symmetry of the curve means equal percentages fall in each tail beyond any given SD boundary. Credit: Wikimedia Commons, CC BY-SA 3.0
This is the single most important fact about the normal distribution for the MCAT. Memorize it cold.
68% of data falls within 1 SD of the mean (between -1 SD and +1 SD)
95% of data falls within 2 SDs of the mean (between -2 SD and +2 SD)
99.7% of data falls within 3 SDs of the mean (between -3 SD and +3 SD)
Worked Example
Suppose IQ scores follow a normal distribution with mean = 100 and SD = 15.
68% of people have IQs between 85 and 115 (100 +/- 15)
95% of people have IQs between 70 and 130 (100 +/- 30)
99.7% of people have IQs between 55 and 145 (100 +/- 45)
An IQ of 130 is exactly 2 SDs above the mean. Since 95% of the data falls within 2 SDs, only 5% falls outside this range. Because the distribution is symmetric, 2.5% falls above 130 and 2.5% falls below 70.
Tail Percentages Quick Reference
Range
% Inside
% Outside (both tails)
% in one tail
Within 1 SD
68%
32%
16%
Within 2 SDs
95%
5%
2.5%
Within 3 SDs
99.7%
0.3%
0.15%
Shifting and Stretching the Curve
Changing the mean shifts the entire bell curve left or right along the number line without changing its shape. Changing the SD changes the width: a larger SD makes the curve wider and flatter, while a smaller SD makes it taller and narrower. The total area under the curve is always 1 (representing 100% of the data), so a wider curve must be shorter to compensate.
In a normal distribution with mean = 50 and SD = 10, what percentage of data falls between 30 and 70?
Click to reveal answer
95%. The value 30 is 2 SDs below the mean (50 - 20 = 30) and 70 is 2 SDs above the mean (50 + 20 = 70). By the 68-95-99.7 rule, 95% of data in a normal distribution falls within 2 SDs of the mean.
If 68% of data falls within 1 SD of the mean, what percentage falls above 1 SD above the mean?
Click to reveal answer
16%. If 68% is within 1 SD, then 32% is outside (in both tails combined). Since the normal distribution is symmetric, each tail contains half: 32% / 2 = 16%. So 16% of data falls more than 1 SD above the mean.