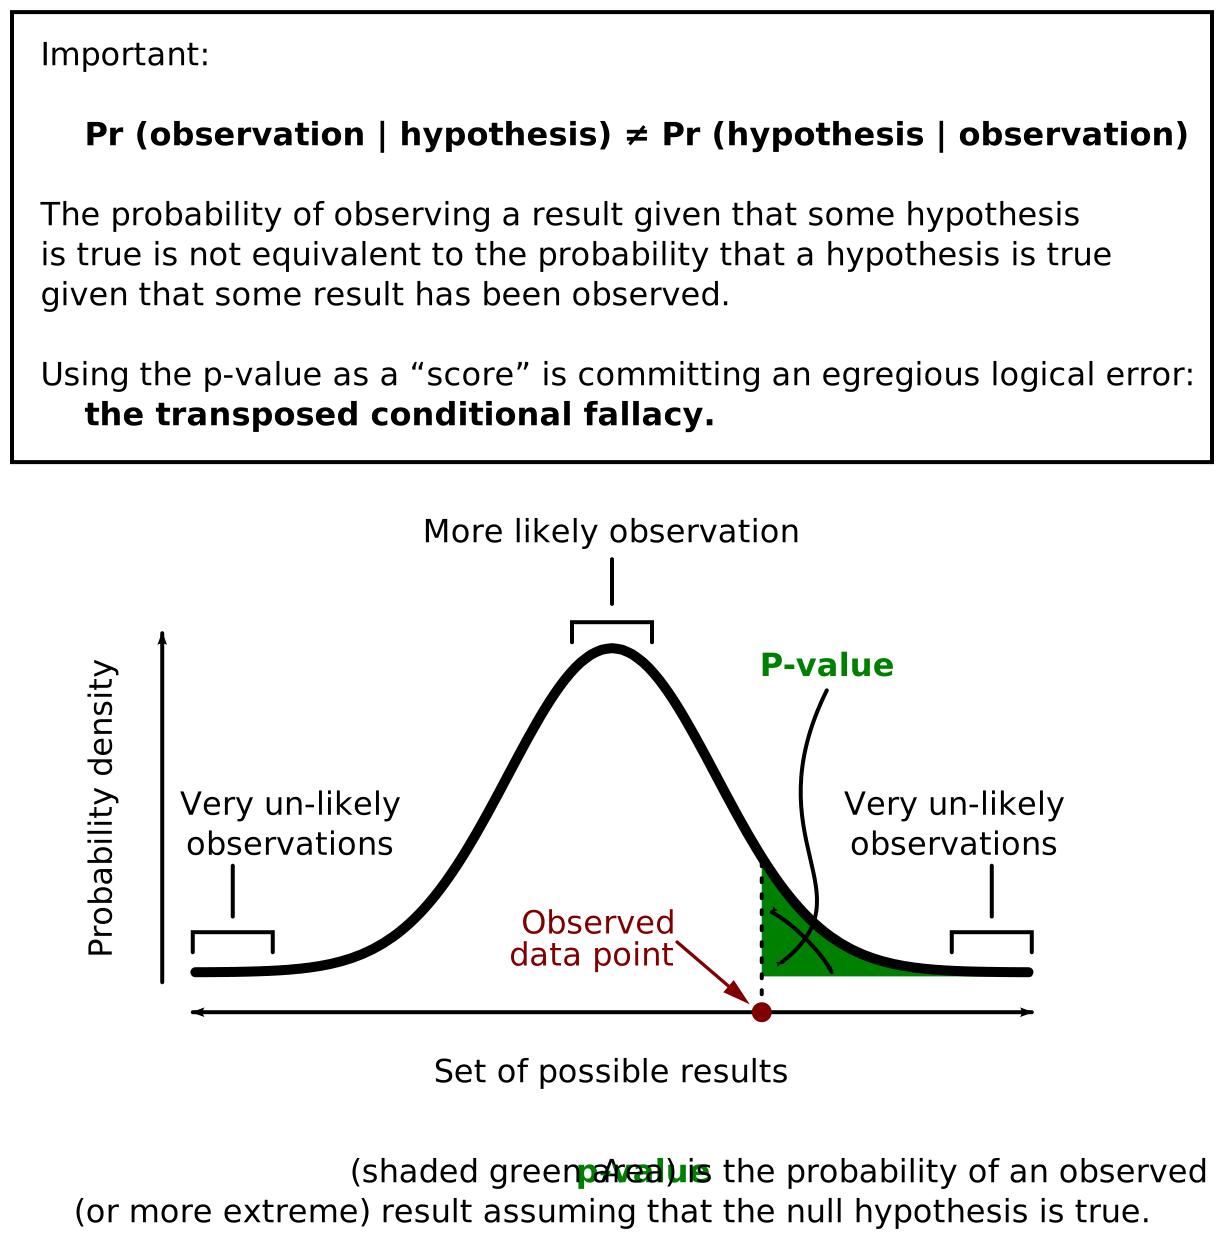
The p-value might be the single most misunderstood number in all of science. Researchers misinterpret it. Journalists butcher it. Even some textbooks get it wrong. The MCAT knows this, and it will test whether you understand what a p-value actually means - and more importantly, what it does not mean. Get this concept right and you have a major advantage on test day.
The Definition
A p-value is the probability of obtaining results at least as extreme as the observed results, assuming the null hypothesis is true.
Read that again slowly. The p-value does not tell you the probability that the null hypothesis is true or false. It tells you how surprising your data would be in a world where the null hypothesis is true.
The p-value represented as the shaded area under the curve beyond the observed test statistic. A smaller shaded area (smaller p-value) means the observed result is more extreme and less likely under the null hypothesis, providing stronger evidence against H-null. Credit: Wikimedia Commons, CC BY-SA 3.0
The 0.05 Threshold
By convention, a p-value less than 0.05 is considered “statistically significant.” This means:
p < 0.05: The result is unlikely enough under H0 that we reject the null hypothesis. “Statistically significant.”
p >= 0.05: The result is not surprising enough under H0 to reject it. “Not statistically significant.”
The 0.05 cutoff is a convention, not a law of nature. Some fields use stricter thresholds (particle physics uses p < 0.0000003). The MCAT almost always uses 0.05 unless stated otherwise.
What the P-Value is NOT
These misconceptions appear as trap answer choices on the MCAT.
Misconception 1: “The p-value is the probability that H0 is true.”
Wrong. The p-value assumes H0 is true and then asks how likely the data is. It does not give you the probability that H0 is true or false.
Misconception 2: “p = 0.03 means there is a 3% chance the result is due to chance.”
Wrong. The p-value is the probability of seeing data this extreme if H0 is true, not the probability that the result is a fluke.
Misconception 3: “A smaller p-value means a larger effect.”
Wrong. A small p-value means the evidence against H0 is strong, but it says nothing about the size of the effect. You can get a tiny p-value from a huge sample even if the actual effect is trivially small.
P-Values and Sample Size
This is a critical nuance the MCAT tests. A large sample size increases the power of a study, making it easier to detect small effects. This means:
A study with 100,000 participants can produce a tiny p-value (say, p = 0.0001) for a completely trivial effect (like a drug that lowers blood pressure by 0.1 mmHg).
A study with 15 participants might produce a large p-value (say, p = 0.15) even if the drug works, simply because the sample was too small to detect the effect reliably.
P-Values in MCAT Passages
Research passages will often state something like: “The difference between groups was significant (p = 0.03)” or “No significant difference was found (p = 0.42).” When you see this, you should be able to:
Determine whether H0 was rejected (p < 0.05) or not (p >= 0.05).
Understand that this is not the probability that the null is true.
Consider whether the sample size might be influencing the result.
A study finds p = 0.03. A student says, "There is a 3% probability that the null hypothesis is true." Is this correct?
Click to reveal answer
No, this is incorrect. The p-value is the probability of obtaining data this extreme (or more extreme) assuming H0 is true. It is NOT the probability that H0 is true. The correct interpretation: "If H0 were true, there is a 3% chance of observing results at least this extreme." This distinction is one of the most commonly tested statistical misconceptions on the MCAT.
Study A (n = 50) finds a 10-point improvement with p = 0.04. Study B (n = 50,000) finds a 0.5-point improvement with p = 0.001. Which study has more clinically meaningful results?
Click to reveal answer
Study A has more clinically meaningful results. Even though Study B has a smaller p-value (stronger evidence against H0), its effect size is tiny (0.5 points). Study A found a 10-point improvement, which is far more likely to matter in practice. Study B achieved its small p-value primarily through its massive sample size, not through a large effect. This illustrates why p-values alone are insufficient - you must also consider effect size.