
Correlation vs. Causation
Ice cream sales and drowning deaths are strongly correlated. As ice cream sales go up, drowning deaths go up. Does ice cream cause drowning? Obviously not. Both increase during summer because of hot weather - a third variable that drives both. This is the most important lesson in all of statistics, and it appears on the MCAT more than almost any other statistical concept: correlation does not equal causation.
The Correlation Coefficient (r)
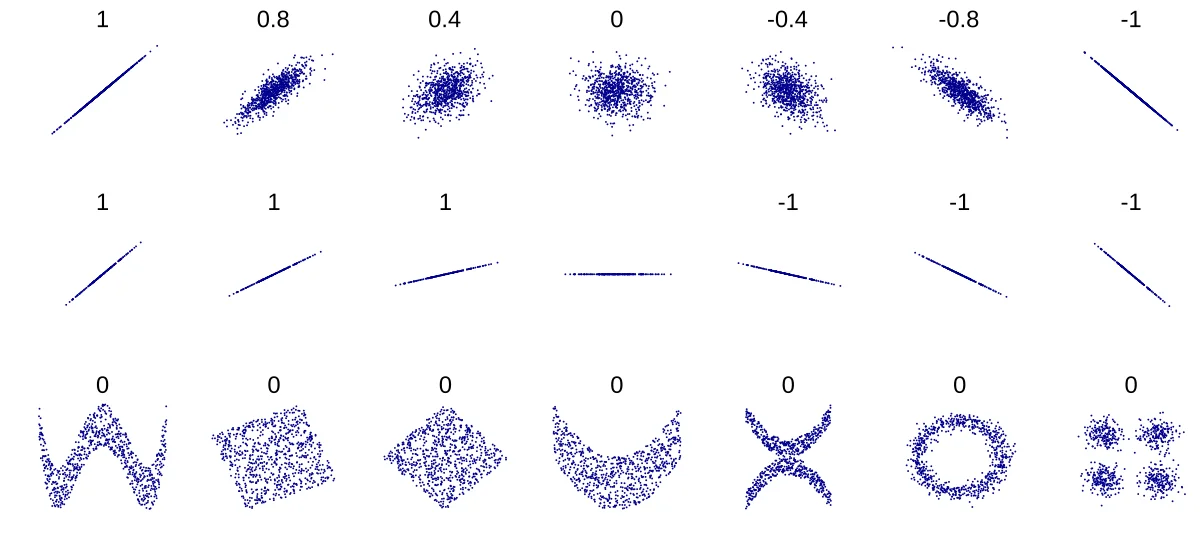
The correlation coefficient r quantifies the strength and direction of a linear relationship between two variables. It ranges from -1 to +1.
- r = +1: Perfect positive correlation. As x increases, y increases in a perfectly linear pattern.
- r = -1: Perfect negative correlation. As x increases, y decreases in a perfectly linear pattern.
- r = 0: No linear relationship. Knowing x tells you nothing about y.
Values between these extremes indicate the strength of the correlation:
| r value | Strength |
|---|---|
| 0.00 to 0.29 | Weak |
| 0.30 to 0.69 | Moderate |
| 0.70 to 1.00 | Strong |
The same ranges apply to negative correlations (just add a minus sign).
What r Does NOT Tell You
1. Causation
A strong correlation (even r = 0.95) does not mean x causes y. It only means they move together. They might both be caused by a third variable.
2. Nonlinear Relationships
r measures only linear relationships. Two variables could have a perfect curved relationship (like a parabola) and still have r = 0. If a scatter plot shows a clear U-shape, the correlation coefficient will underestimate the true relationship.
3. Appropriateness for Outliers
A single extreme outlier can sharply inflate or deflate r. Always look at the scatter plot, not just the number.
Correlation vs. Causation: The Three Criteria
For a researcher to claim that A causes B, three conditions must be met:
- Correlation exists. A and B must be associated (necessary but not sufficient).
- Temporal precedence. A must come before B in time. The cause must precede the effect.
- Elimination of alternative explanations. Other variables (confounders) that could explain the relationship must be ruled out. This is why randomized controlled trials are the gold standard - randomization distributes confounders equally between groups.
Confounding Variables (Third Variables)
A confounding variable is a hidden factor that is related to both the independent and dependent variables, creating the illusion of a direct relationship between them.
Classic examples:
- Ice cream sales and drowning: Confound = summer heat (causes both).
- Shoe size and reading ability in children: Confound = age (older children have bigger feet AND read better).
- Number of firefighters at a fire and property damage: Confound = size of fire (bigger fires bring more firefighters AND cause more damage).
Study Types and Causal Claims
| Study Type | Can Establish Correlation? | Can Establish Causation? |
|---|---|---|
| Case report | No (single observation) | No |
| Cross-sectional survey | Yes | No (no time order) |
| Cohort study | Yes | Suggestive but not definitive |
| Randomized controlled trial | Yes | Yes (strongest evidence) |