
Central Tendency
Imagine you are trying to describe the “typical” income in a neighborhood. You could average everyone’s salary, find the middle salary, or identify the most common salary. Each approach gives a different answer, and each tells a different story. Central tendency is about summarizing a dataset with a single representative number - but choosing the wrong measure can be seriously misleading.
Mean (Average)
The mean is the sum of all values divided by the number of values. It is the most commonly used measure of central tendency.
Mean = (sum of all values) / n
The mean uses every data point in the calculation, which makes it powerful but also makes it vulnerable. A single extreme value can drag the mean far from where most of the data actually lives.
Median
The median is the middle value when all data points are arranged in order. If there is an even number of values, the median is the average of the two middle values.
The median is resistant to outliers. No matter how extreme the highest or lowest value is, the median stays anchored in the center of the data. This makes it the preferred measure for skewed distributions.
Mode
The mode is the most frequently occurring value in a dataset. A dataset can have one mode (unimodal), two modes (bimodal), or more (multimodal). If no value repeats, there is no mode.
The mode is the only measure of central tendency that works for categorical data. You cannot calculate the mean or median of eye colors, but you can find the most common eye color (the mode).
Symmetric vs. Skewed Distributions
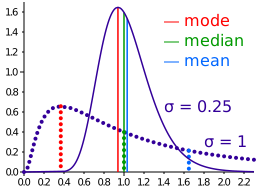
The relationship between mean, median, and mode tells you about the shape of a distribution.
Symmetric distribution: Mean = Median = Mode. The data is balanced around the center. A bell curve is the classic example.
Right-skewed (positive skew): Mean > Median > Mode. A long tail stretches to the right, pulling the mean in that direction. Example: household income in most countries.
Left-skewed (negative skew): Mean < Median < Mode. A long tail stretches to the left, pulling the mean down. Example: age at retirement (most people retire around 65, but a few retire very young).
Visualizing the Order
For a right-skewed distribution, picture the values along a number line from left to right:
Mode - Median - Mean (mean pulled right toward the tail)
For a left-skewed distribution:
Mean - Median - Mode (mean pulled left toward the tail)
When to Use Each Measure
| Situation | Best Measure | Why |
|---|---|---|
| Symmetric, no outliers | Mean | Uses all data, most informative |
| Skewed data | Median | Not affected by extreme values |
| Outliers present | Median | Resistant to being pulled by extremes |
| Categorical data | Mode | Only option for non-numeric data |
| Bimodal data | Mode(s) | Reveals that data has two clusters |