
TLC
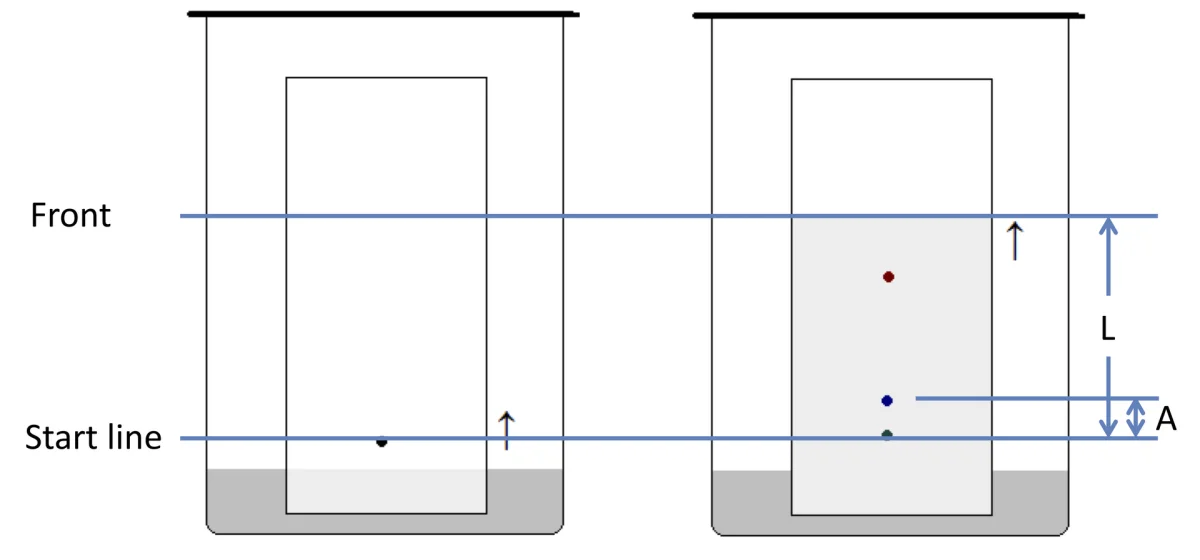
Thin-layer chromatography (TLC) is a fast, cheap, qualitative separation technique used in almost every organic chemistry lab. A TLC plate is a glass, plastic, or aluminum backing coated with a thin layer of adsorbent (usually silica gel, ~0.25 mm thick). A drop of the mixture is spotted at the bottom, and the plate is placed in a jar with the mobile phase (solvent).
As solvent travels up the plate by capillary action, compounds move along with it. Different compounds move at different speeds depending on their interaction with the silica (stationary phase) vs. the solvent (mobile phase).

The Rf Value
The retention factor (Rf) is:
Rf = (distance compound traveled) / (distance solvent front traveled)
Values range from 0 (compound stuck at the origin) to 1 (compound moved with the solvent front).
- High Rf (greater than 0.6): the compound is nonpolar (or the solvent is very polar) - moves far.
- Low Rf (less than 0.3): the compound is polar (or the solvent is nonpolar) - sticks near the origin.
- Ideal Rf: 0.3-0.6 - good separation and detection.
If two compounds have very different Rf values, they can be separated; if their Rf values are similar, try a different solvent.
Interactive Simulator
Spot compounds at the baseline, slide the eluent polarity from 100% hexane to 100% methanol, and press Develop to migrate the solvent front up the plate. Rf values update live from a lookup table of common MCAT compounds so you can see how solvent choice changes separation.
TLC plate simulator
| Lane | Compound | Rf |
|---|---|---|
| 1 | Benzyl alcohol | 0.42 |
| 2 | Acetone | 0.50 |
| 3 | Benzoic acid | 0.12 |
Why Polarity Matters
Silica gel is polar (Si-OH groups on the surface). Polar compounds bind to silica tightly via H-bonding and dipole-dipole interactions. They move slowly.
Nonpolar compounds have little affinity for silica. They are carried along with the solvent and move faster.
The mobile phase can be tuned: more polar solvent (like methanol, acetic acid) pulls compounds off silica faster. Nonpolar solvent (hexane) keeps them stuck.
Typical TLC solvent systems: ethyl acetate / hexane (common), DCM / methanol, or mixed polar systems.
Normal Phase vs. Reverse Phase
- Normal phase TLC uses polar stationary phase (silica, alumina) and nonpolar mobile phase. Polar compounds move slow.
- Reverse phase TLC uses nonpolar stationary phase (silanized silica, C18-bonded silica) and polar mobile phase (often methanol/water). Polar compounds move faster.
For most simple organic TLC, normal phase is used. Reverse phase is common in biological and pharmaceutical samples.
Detection
After running, the plate is dried. Compounds are visualized by:
- UV light (254 nm): silica plates often have a fluorescent indicator; UV-absorbing compounds appear as dark spots.
- Iodine vapor: many compounds form a yellow/brown spot in I₂.
- Staining reagents: KMnO₄ (oxidizable groups), ninhydrin (amines/amino acids), phosphomolybdic acid (many organics).
Applications
- Reaction monitoring: spot starting material and reaction mixture side by side. As reaction proceeds, the starting material spot disappears and a new product spot appears.
- Purity check: one spot = pure compound; multiple spots = mixture.
- Identification: comparing Rf with a known standard can identify a compound.
- Scale-up planning: TLC Rf data predict column chromatography behavior.
Typical TLC Workflow
- Cut a TLC plate (5-8 cm tall).
- Draw a light pencil line ~1 cm from the bottom.
- Spot samples along the line using a fine capillary (~0.5-1 mm spots, well-spaced).
- Place the plate in a jar containing ~0.5 cm of developing solvent (do NOT let solvent touch the spots).
- Cover the jar; let the solvent rise by capillary action.
- When the solvent front is ~1 cm from the top, remove the plate.
- Mark the solvent front immediately with pencil.
- Dry and visualize.
- Measure distances to calculate Rf.