
Gel Electrophoresis
Gel electrophoresis separates charged macromolecules (proteins, DNA, RNA) by applying an electric field across a gel matrix. Molecules migrate through the gel’s pores based on their charge, size, and shape. Different gel types and conditions select for different properties.
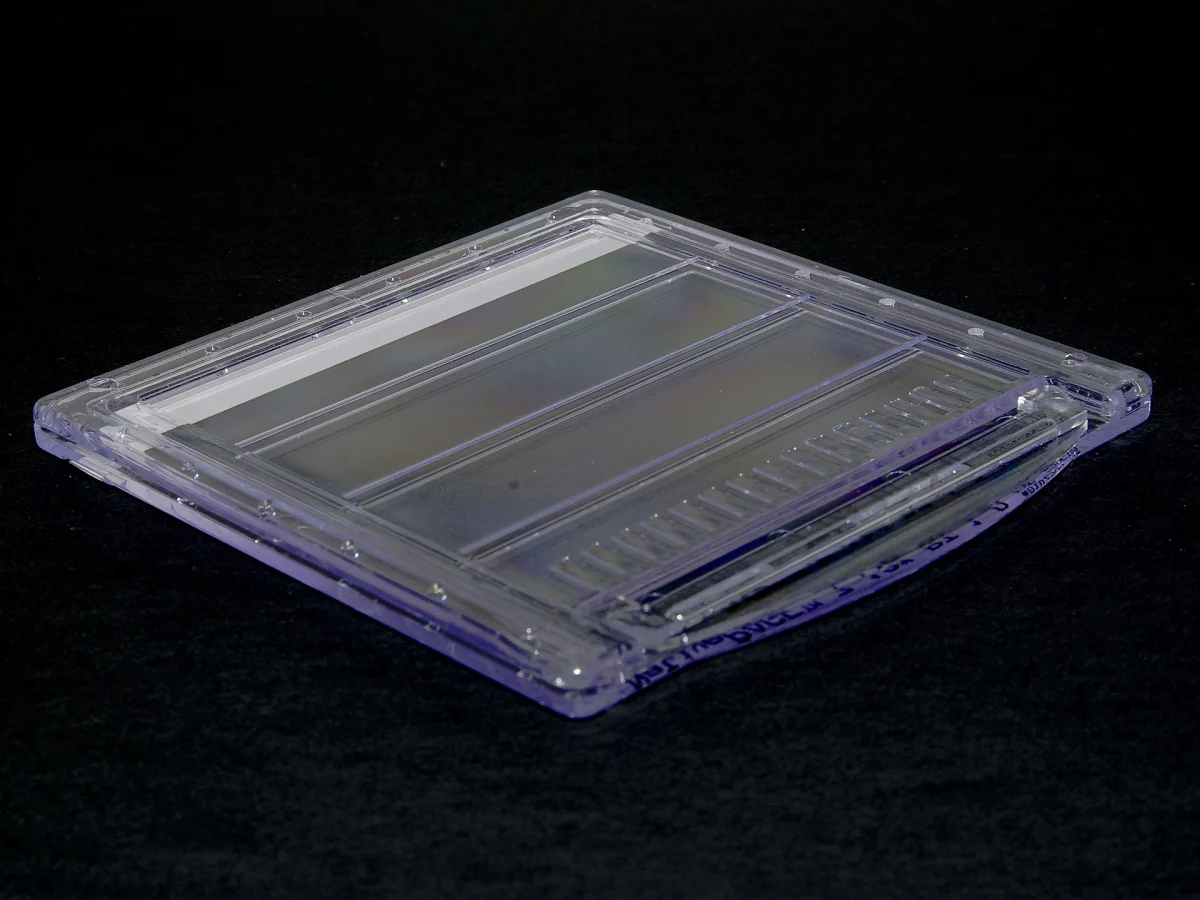
SDS-PAGE: Size-Based Protein Separation
SDS-PAGE (sodium dodecyl sulfate-polyacrylamide gel electrophoresis) is the standard technique for separating proteins by molecular weight.
- Denaturation: proteins are boiled in SDS (sodium dodecyl sulfate, an anionic detergent) and a reducing agent (β-mercaptoethanol or DTT). SDS coats the protein uniformly, denatures it into a linear shape, and gives it a large negative charge proportional to its length. Reducing agent breaks disulfide bonds.
- Gel loading: the prepared protein samples are loaded into wells at the top of a polyacrylamide gel.
- Electrophoresis: an electric field pulls the negatively charged proteins toward the positive electrode (anode, bottom). Small proteins move fast through the gel’s pore network; large proteins are slowed.
- Staining: after electrophoresis, the gel is stained (Coomassie blue, silver stain, or fluorescent stains like SYPRO) to visualize proteins.
Because SDS overwhelms the native charge differences between proteins, SDS-PAGE separates PURELY BY SIZE. A molecular weight marker ladder is run alongside to estimate each band’s MW.
Why Smaller Proteins Move Faster
The polyacrylamide gel has a porous network. Small proteins squeeze through easily; large proteins get physically caught in the mesh. The gel acts as a molecular sieve, size-selectively.
Gel percentage controls pore size:
- Low % (4-8%): large pores, good for big proteins (>100 kDa).
- High % (12-15%): small pores, good for small proteins (<30 kDa).
Native Gel Electrophoresis
Native PAGE omits SDS and denaturation. Proteins retain their folded structure and native charge. Separation is by:
- Size (still pore-size-dependent).
- Charge (charged proteins move faster).
- Shape (compact vs. extended proteins migrate differently).
Native gels preserve biological activity - useful for studying protein-protein interactions or enzyme activity within the gel.
Isoelectric Focusing (IEF)
IEF uses a pH gradient in the gel. Proteins stop migrating when they reach the pH equal to their pI (where they have no net charge). IEF separates proteins by pI rather than size.
2D-PAGE
Combining IEF (first dimension) and SDS-PAGE (second dimension) gives 2D-PAGE:
- First, separate by pI using IEF.
- Then rotate 90° and separate by size using SDS-PAGE.
The result is a 2D scatter of protein spots, each with a unique (pI, MW) pair. 2D-PAGE is the classic tool of proteomics, revealing hundreds to thousands of protein spots in a single experiment.
DNA Gel Electrophoresis
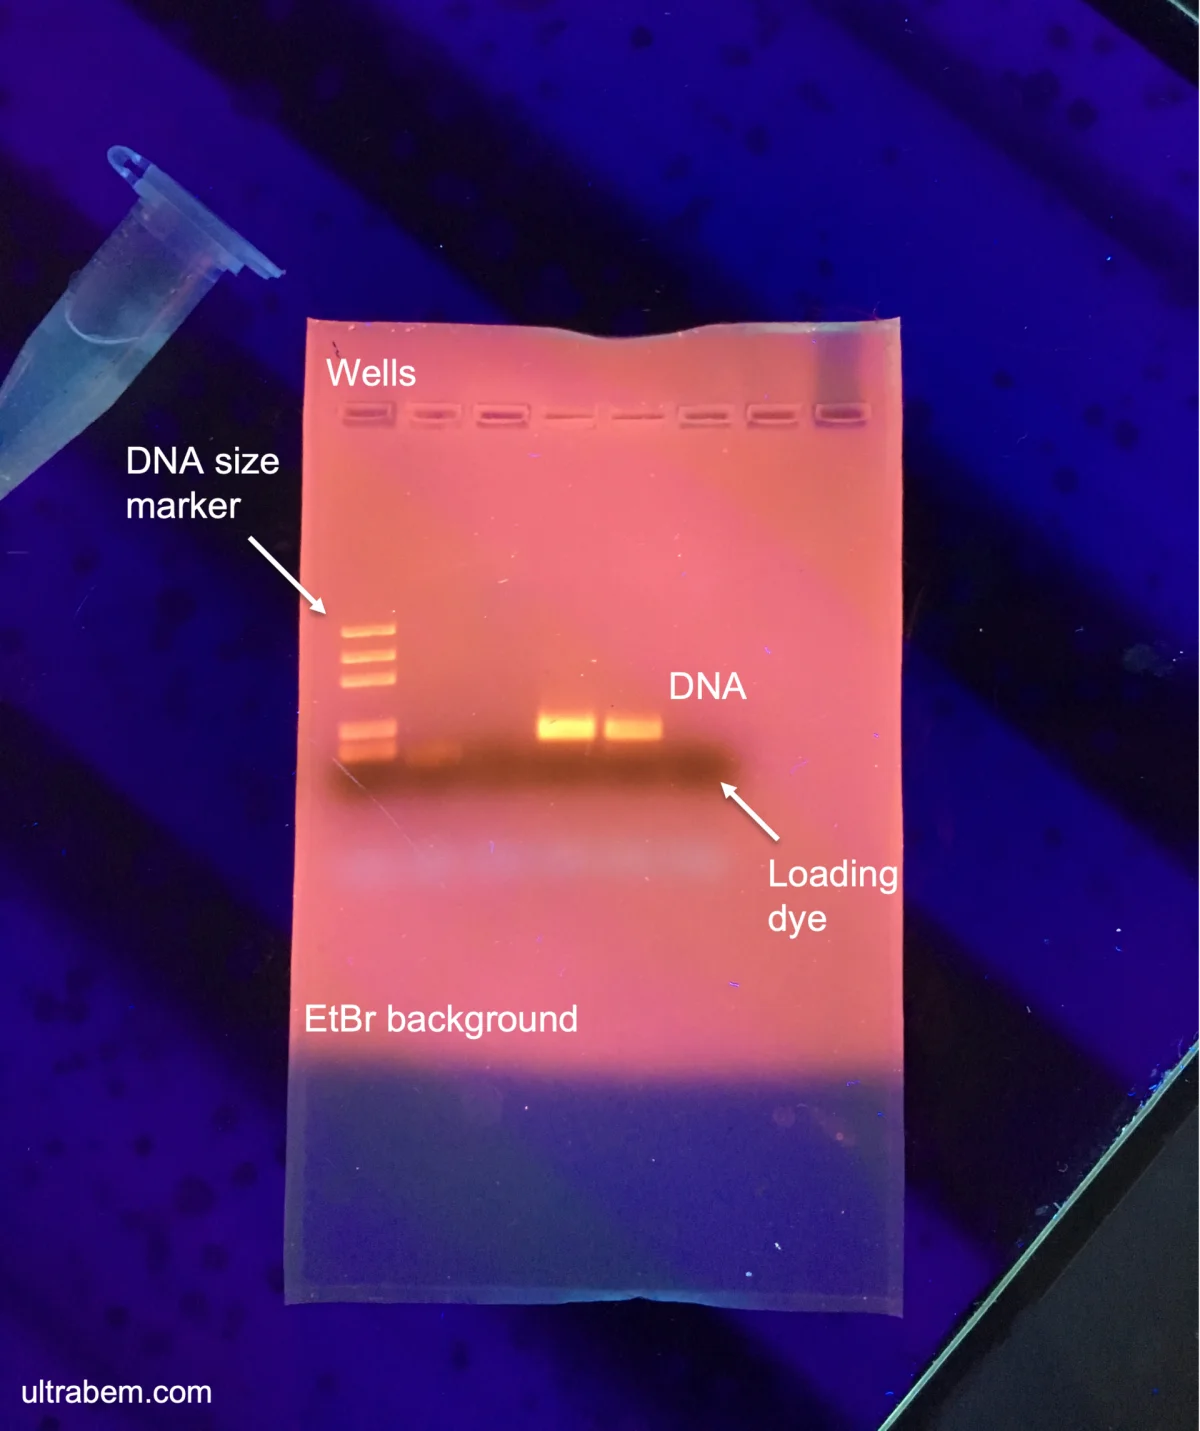
DNA electrophoresis uses AGAROSE gel (not polyacrylamide) for larger molecules:
- DNA is already negatively charged (from its phosphate backbone).
- Smaller DNA fragments move faster.
- Ethidium bromide or SYBR Safe stains DNA for visualization.
Used in PCR, cloning, and restriction analysis.
Molecular Weight Ladders
A reference “ladder” (mixture of proteins or DNA fragments of known sizes) is run alongside samples. Comparing band positions to the ladder lets you estimate each band’s MW.
Common protein markers: 10, 15, 25, 37, 50, 75, 100, 150, 250 kDa.
Common DNA markers: 100 bp, 500 bp, 1 kb, 2 kb, 5 kb, 10 kb.