
Phase Diagrams
A heating curve (§3.6) shows what happens when you add heat at constant pressure. A phase diagram is more powerful — it maps out which phase a substance occupies at every combination of temperature and pressure. One glance tells you whether a substance is solid, liquid, or gas under any given conditions.
Phase diagrams also explain pressure cookers, why water boils at a lower temperature in Denver than in Miami, why freeze-drying works, and why ice melts when you press hard on a skate blade. The MCAT loves them because a single picture covers a lot of conceptual ground.
Anatomy of a Phase Diagram
A standard phase diagram has temperature on the x-axis and pressure on the y-axis. Three regions represent the three phases (solid, liquid, gas), separated by boundary lines where phase transitions happen.
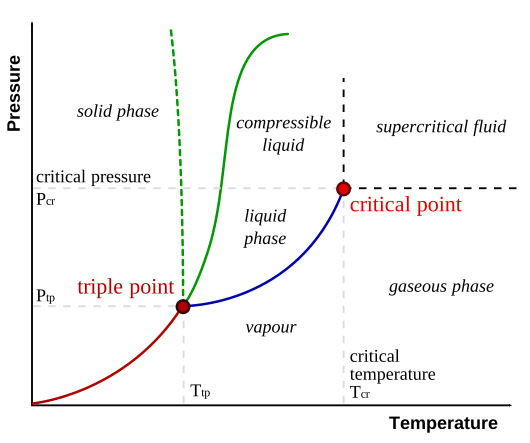
The Boundary Lines
Each boundary line represents conditions where two phases coexist in equilibrium:
- Solid-liquid line (fusion curve) - melting/freezing happens along this line
- Liquid-gas line (vaporization curve) - boiling/condensation happens along this line
- Solid-gas line (sublimation curve) - sublimation/deposition happens along this line
Moving across a boundary means a phase transition is happening. Standing on a boundary means both phases exist at the same time.
The Triple Point
The triple point is the single temperature-pressure combination where all three phases coexist at once. It is a unique, fixed point for every substance.
For water: triple point is at 0.01 °C and 611 Pa (about 0.006 atm). At pressures below the triple point, liquid water cannot exist - ice can only sublime directly to vapor.
The Critical Point
The critical point is the endpoint of the liquid-gas boundary line. Above the critical temperature and pressure, the difference between liquid and gas disappears. The substance becomes a supercritical fluid - it has properties of both a liquid (density, dissolving ability) and a gas (fills its container, low viscosity).
Beyond the critical point, you can go from “liquid-like” to “gas-like” without ever crossing a phase boundary - there is no sudden boiling transition.
Reading a Phase Diagram
To answer MCAT questions about phase diagrams:
- Locate the point on the diagram using the given T and P
- Identify the region - that tells you the phase
- Trace a path to predict what happens when you change T or P
- Check for phase transitions - does your path cross a boundary line?
Example: Start with water at 1 atm and 50 °C (liquid region). Heat at constant pressure (move right along a horizontal line). You cross the liquid-gas boundary at 100 °C and enter the gas region. The water boils.
Example: Start with water at 1 atm and 50 °C. Lower the pressure at constant temperature (move down along a vertical line). If you drop below the liquid-gas boundary, the water boils - at 50 °C! This is the principle behind vacuum distillation.
Water’s Anomalous Phase Diagram
Most substances have a solid-liquid boundary that slopes to the right (positive slope) - higher pressure favors the solid because it is denser. Water is different. Its solid-liquid line slopes slightly to the left (negative slope) because ice is less dense than liquid water.
This means raising pressure on ice at its melting point will melt it - pressure favors the denser phase (liquid water). This unusual behavior is often tested on the MCAT.
Effect of Pressure on Boiling Point
The liquid-gas boundary line shows that boiling point increases with pressure. This is why:
- Water boils below 100 °C at high altitudes (lower atmospheric pressure)
- Water boils above 100 °C in a pressure cooker (higher pressure)
- At the triple point pressure, boiling and freezing happen at nearly the same temperature