
Energy Diagrams
Energy diagrams are one of the most efficient tools in physics — a single PE-vs-position graph can tell you where an object will accelerate, where it will stop and reverse, where the equilibrium points are, and whether each equilibrium is stable or unstable.
The MCAT loves them because they reward big-picture reasoning. Read the graph fluently and you can answer five different questions about the same object’s motion without doing any algebra.
The mental trick that makes the whole thing click: imagine the PE curve as an actual landscape, and visualize a marble rolling on it. Valleys catch the marble (stable equilibrium). Hilltops throw it off in either direction (unstable equilibrium). The marble always rolls downhill on the PE graph — that’s the force.
Reading a PE vs. Position Graph
A potential-energy diagram puts PE on the y-axis and position on the x-axis. The total mechanical energy () is drawn as a horizontal line across the graph, since total energy stays constant when only conservative forces act.
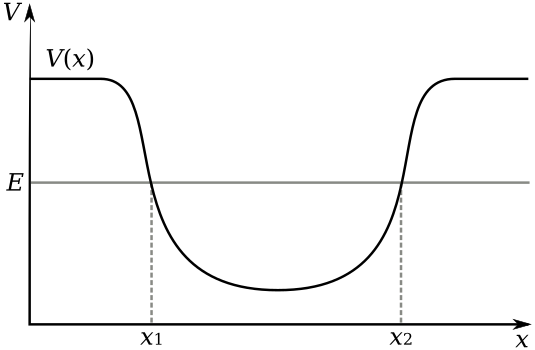
At any position, the kinetic energy is the vertical gap between the total-energy line and the PE curve:
This is the whole secret. Pick a position → look up the height of the PE curve there → subtract from total energy → that’s the KE → so the object is moving fast where PE is low and slow where PE is high.
Turning Points
A turning point is where — the object momentarily stops and reverses direction. Graphically, it’s where the PE curve touches the total-energy line.
Between two turning points, the object oscillates back and forth (like a marble rolling in a bowl). The object can’t cross a PE “hill” that rises above its total-energy line — it doesn’t have enough KE to climb over. It’s effectively trapped.
This is exactly why a pendulum swings between two endpoints (its turning points) and not beyond — its mechanical energy isn’t enough to climb any higher.
Three Types of Equilibrium
Equilibrium happens wherever the slope of the PE curve is zero (flat spots). But not all equilibria are equal — the shape of the curve at the flat spot determines whether the equilibrium holds up under a small push.
| Type | PE curve shape | Behavior when displaced | Physical analogy |
|---|---|---|---|
| Stable | Valley (local minimum) | Returns to equilibrium | Marble in a bowl |
| Unstable | Hilltop (local maximum) | Accelerates away | Marble on top of a hill |
| Neutral | Flat region | Stays in new position | Marble on a tabletop |
Force from the PE Curve
There’s a direct relationship between the PE curve and the force on the object:
The negative sign matters. It encodes the “rolls downhill” intuition: force always points toward lower PE — never higher. Steep PE = strong force. Gentle PE = weak force. Flat PE = no force.
You don’t need calculus on the MCAT — just eyeball the slope of the PE curve at the position you’re asked about. Steep down to the right → strong force pointing right. Steep down to the left → strong force pointing left.
Putting It All Together: A Complete Example
Imagine a PE curve with a deep valley at , a small hill at , and a shallow valley at . An object has total energy shown as a horizontal line cutting through both valleys but just above the hilltop.
What can you say?
- The object placed in the deep valley near oscillates between its two turning points (where the PE curve touches the line).
- If is high enough to clear the hill at , the object can travel into the shallow valley at . If not, it’s trapped on one side.
- At and (valley bottoms), the slope is zero → force = 0 → both are equilibrium positions. They’re stable (valleys).
- At (hilltop), slope is also zero → force = 0 → equilibrium, but unstable.
- Maximum KE (and maximum speed) occurs at the deepest point of the deepest valley — biggest gap between and PE.
- Speed is zero at every turning point.
Summary: Attacking Energy Diagram Problems
- Find the total-energy line (horizontal).
- Find turning points where the PE curve meets the energy line ().
- KE at any position = vertical gap between and PE.
- Maximum speed at the deepest valley bottom (largest KE).
- Equilibrium points where slope = 0 (valleys = stable, hilltops = unstable, flat = neutral).
- Force always points toward lower PE; steeper slope = bigger force.