Stratification and Mobility
Social stratification is the hierarchical arrangement of groups in a society based on resources, power, and status. It is nearly universal in human societies. This section covers how stratification is measured, how people move within it, and what counts as poverty.
Dimensions of Stratification (Weber)
Weber identified three dimensions of stratification:
- Class. Economic position - income, wealth, property. Determines life chances.
- Status. Prestige and social honor. Not always correlated with income (a respected professor may earn less than a mediocre finance professional).
- Party (power). Political influence - the ability to shape outcomes and policy.
The three dimensions can be aligned (a wealthy politician has class, status, and power) or diverge (an artist may have status and cultural influence without class). Multi-dimensional stratification is more accurate than a single economic class hierarchy.
Class Categories
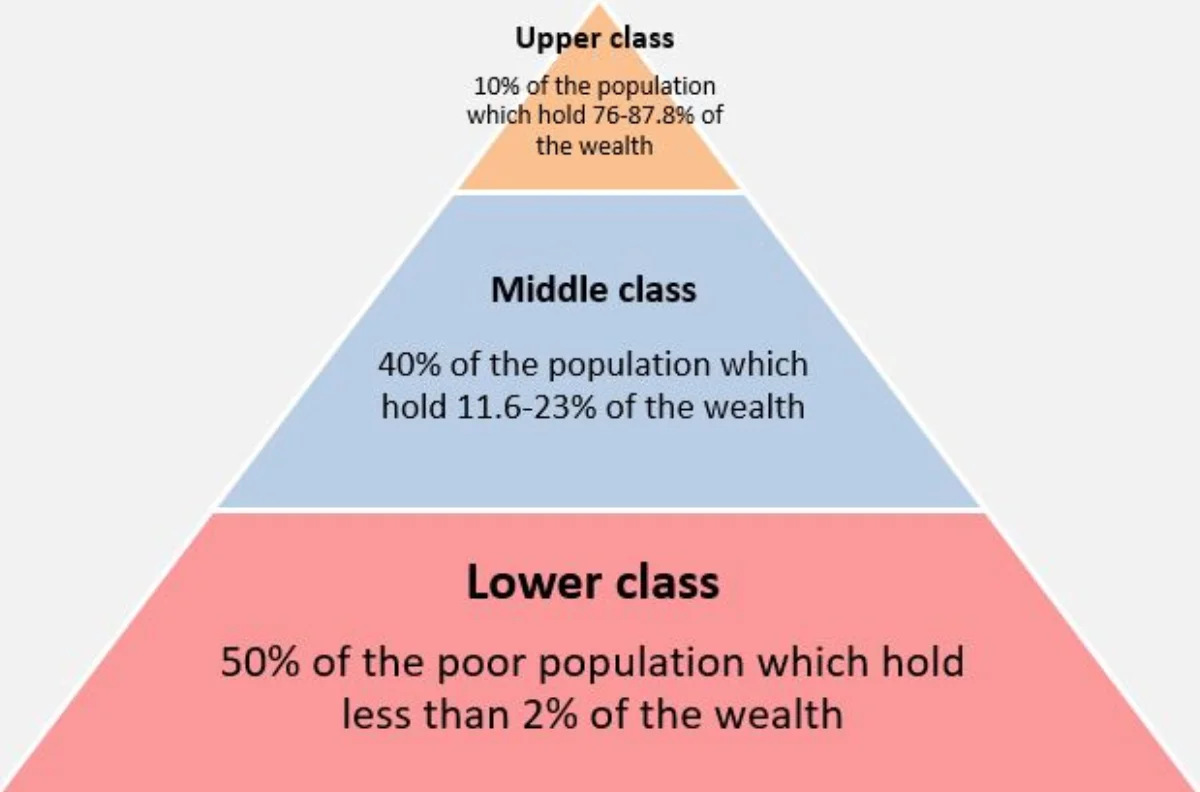
Modern U.S. class categories (roughly):
- Upper class (~1%). Substantial wealth, often inherited. Top executives, heirs, some entrepreneurs.
- Upper-middle class. Professionals (doctors, lawyers, engineers), upper management. High education, comfortable lifestyle.
- Lower-middle class. Lower-level professionals, teachers, supervisors. Education and stable jobs but less financial security.
- Working class. Manual and service workers with less education. Often paycheck-to-paycheck.
- Lower class (poor/underclass). Unemployed, underemployed, or very low wages. Limited access to resources.
Categories are fuzzy and debated. Some sociologists use finer divisions or different frameworks.
Social Mobility
Social mobility is movement between positions in the stratification system.
Types of Mobility
- Intergenerational. Comparing position to your parents’ position. A doctor with farm-worker parents has moved up intergenerationally.
- Intragenerational. Comparing your position at different points in your own life. Promoted from clerk to manager = intragenerational upward mobility.
- Upward vs. downward - moving higher or lower.
- Vertical (changes social class) vs. horizontal (changes job or position within the same class).
- Structural mobility. Large-scale movement of many people caused by changes in the economy (industrialization creating middle-class jobs). Different from individual merit-based mobility.
Factors Affecting Mobility
- Education. Strongest single predictor of upward mobility.
- Family of origin. Starting point heavily influences outcomes.
- Race, gender, geography. Structural factors shape access.
- Economic conditions. Boom times enable upward mobility; recessions push many downward.
The United States has less intergenerational mobility than many other developed countries despite the cultural myth of the “American Dream” - children’s economic outcomes correlate strongly with their parents’.
Poverty
Absolute vs. Relative Poverty
- Absolute poverty. Lacking the resources needed to meet basic needs - food, shelter, clean water, basic healthcare. The World Bank defines extreme poverty as living on less than $2.15/day (2017 PPP).
- Relative poverty. Having significantly less than the median income in one’s society. A family “poor” in the U.S. may have resources exceeding the middle class of some developing countries, but still faces exclusion from mainstream society.
The U.S. Poverty Line
The U.S. poverty line is an absolute measure based on minimum food budget multiplied by three, adjusted for family size. Critics argue it understates modern poverty - it doesn’t adjust for geography, housing costs, or changes in what families need.
Social Exclusion
Social exclusion goes beyond income. People are excluded when they can’t fully participate in economic, political, social, or cultural life due to:
- Poverty.
- Discrimination.
- Disability.
- Geographic isolation.
- Lack of education or skills.
Exclusion reinforces itself - excluded individuals face reduced access to the opportunities that could reduce exclusion.
Environmental Justice
Environmental justice examines how environmental hazards (pollution, contaminated water, lack of green space) disproportionately affect marginalized communities. A form of structural inequality.
Global Inequality
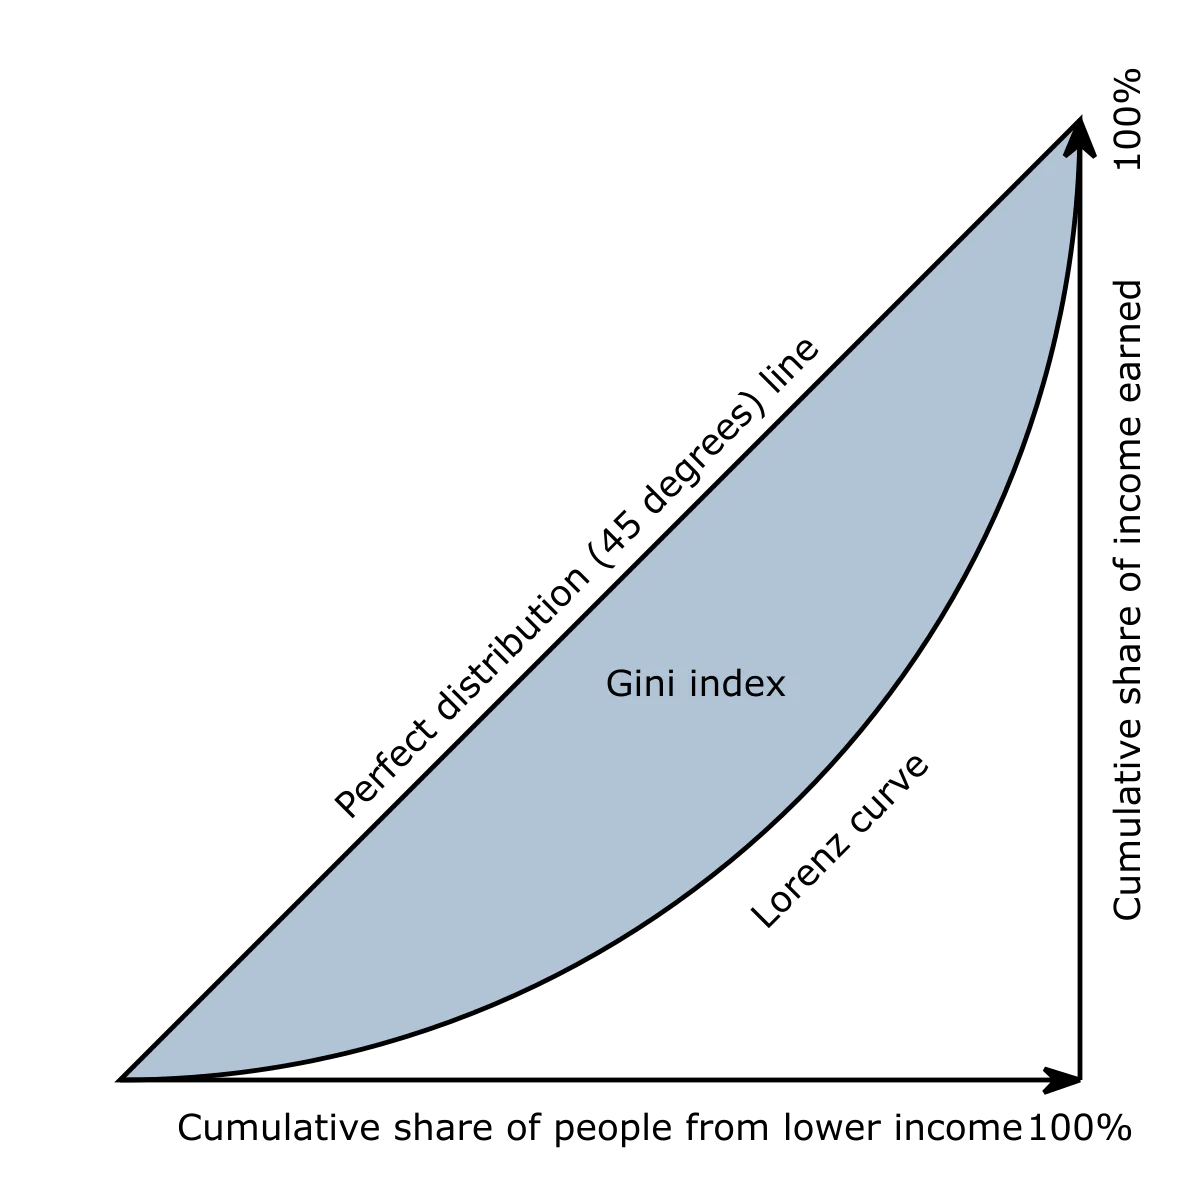
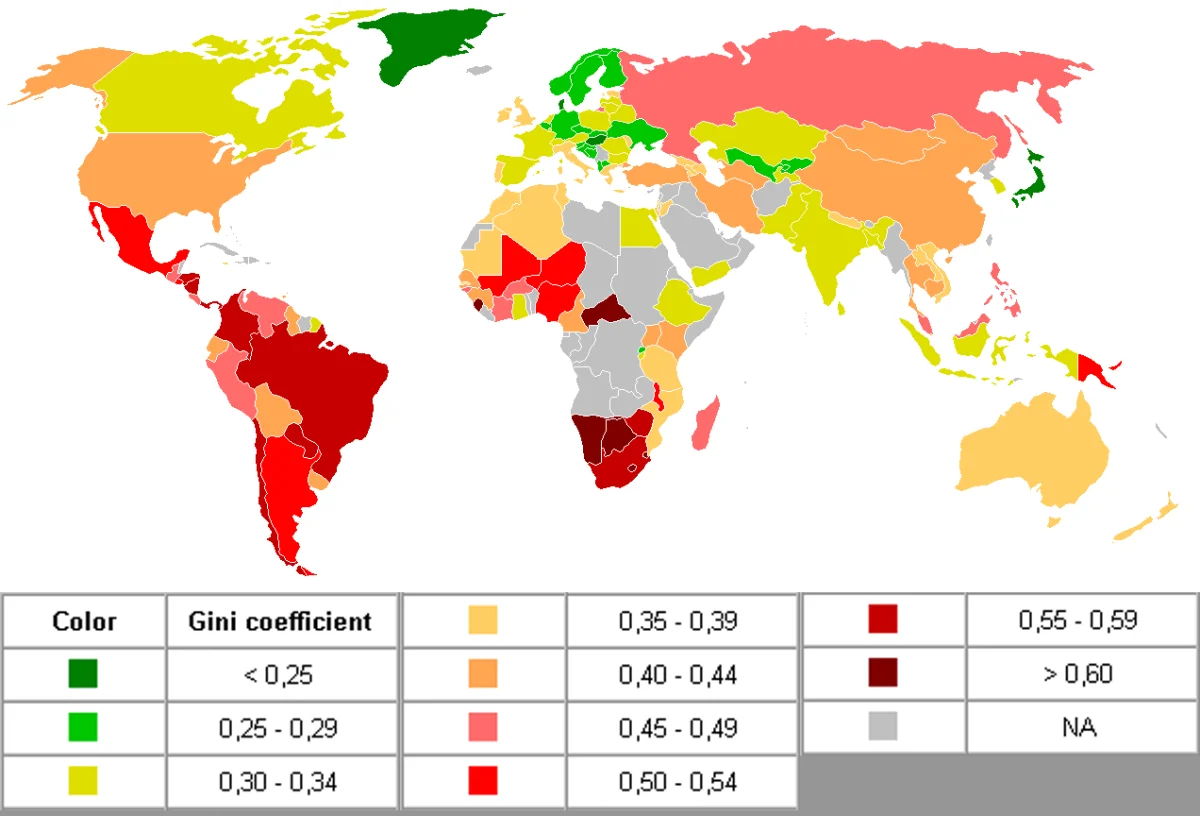
Inequality between countries is enormous - the richest countries’ per-capita incomes can be 100× those of the poorest. Global inequality between countries has been declining (as many developing countries grow), but inequality within countries has increased in many places.
Healthcare Disparities in the U.S.
Healthcare outcomes vary dramatically by:
- Income. Lower-income Americans have worse health and shorter life expectancy.
- Race. Black Americans have higher rates of maternal mortality, cardiovascular disease, and COVID-19 mortality. Native Americans face specific health burdens.
- Geography. Rural areas have fewer hospitals, longer ambulance times, and worse outcomes for many conditions.
- Insurance status. Uninsured Americans delay care and have worse outcomes.
These disparities reflect structural inequality, not individual choices.
Class Consciousness and False Consciousness
Marxian concepts:
- Class consciousness. Awareness of one’s class position and shared interests with other class members. Prerequisite for collective action.
- False consciousness. Belief in ideas that actually work against one’s class interests. Workers who identify with the wealthy and oppose redistribution, despite being economically disadvantaged themselves. Preserves existing power structures.