
Emission & Absorption Spectra
Watch a fireworks display: reds, greens, blues, and golds exploding across the sky. Each color comes from a different element — strontium for red, barium for green, copper for blue. The atoms get heated to extreme temperatures, their electrons jump to excited states, and as those electrons fall back down to lower levels, they release photons of very specific wavelengths.
Every element has its own unique fingerprint of colors — its emission spectrum. This is how astronomers identify what stars are made of without ever visiting them: they read the spectrum of light coming from the star and match the lines to known elements. The same principle drives flame tests in chemistry labs, neon signs, and spectroscopic medical diagnostics.
Three Types of Spectra
Continuous Spectrum
A hot, dense object (like a light bulb filament or the sun’s surface) emits light at all wavelengths, producing a smooth rainbow with no gaps. This is called a continuous spectrum or blackbody spectrum.
Emission Spectrum (Bright Lines)
A hot, low-density gas emits light at only specific wavelengths, producing bright colored lines on a dark background. Each line corresponds to a specific electron transition within the atom. Every element has a unique set of emission lines - an atomic fingerprint.
Absorption Spectrum (Dark Lines)
When continuous light passes through a cool gas, the gas absorbs photons at the exact wavelengths it would normally emit. The result is a continuous rainbow with dark lines at specific positions. The dark lines in an absorption spectrum appear at the same wavelengths as the bright lines in the emission spectrum of the same element.
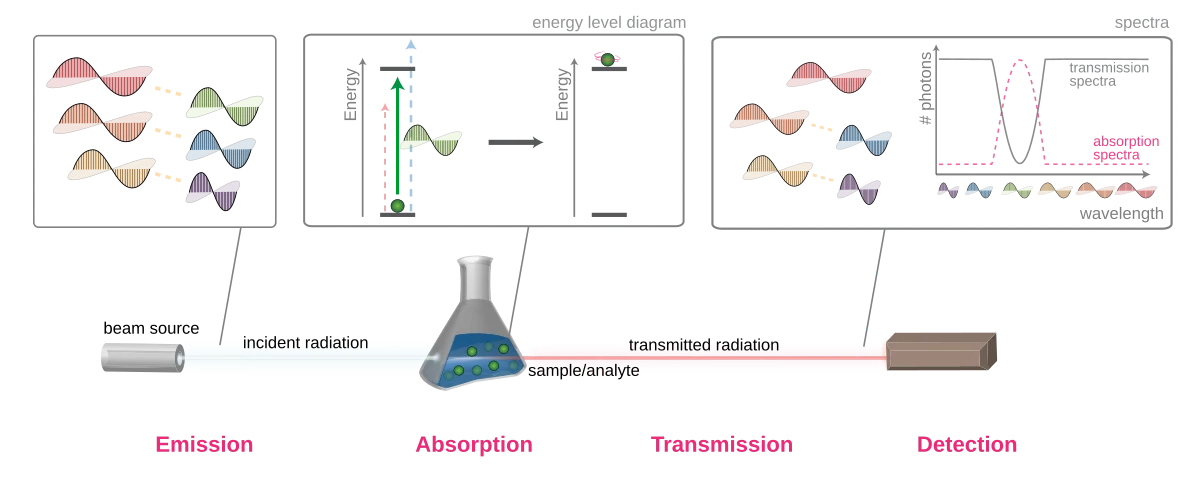
Hydrogen Spectral Series
Hydrogen’s emission lines are grouped into series based on the lower energy level the electron falls to:
| Series | Final Level (n) | Region | Notes |
|---|---|---|---|
| Lyman | n = 1 | Ultraviolet | Highest energy transitions |
| Balmer | n = 2 | Visible | The one you can see with your eyes |
| Paschen | n = 3 | Infrared | Lower energy transitions |
Why Lyman Is UV and Balmer Is Visible
Transitions down to n = 1 involve the largest energy gaps (recall the energy levels crowd together at higher n). Large energy gaps mean high-frequency, short-wavelength photons - ultraviolet. Transitions to n = 2 involve moderate energy gaps, landing in the visible range. Transitions to n = 3 have the smallest gaps and produce low-energy infrared photons.
Within each series, the transition from the nearest level (n + 1 to n) produces the lowest-energy photon, and the transition from n = infinity to n produces the highest-energy photon (the series limit).
Example: Balmer Series
The Balmer series includes all transitions ending at n = 2:
- n = 3 to n = 2: red light (656 nm)
- n = 4 to n = 2: blue-green (486 nm)
- n = 5 to n = 2: blue-violet (434 nm)
- n = 6 to n = 2: violet (410 nm)
Notice the lines get closer together at shorter wavelengths, converging toward the series limit at 365 nm.
Connecting Spectra to Energy Levels
Every spectral line corresponds to one specific transition between two energy levels. If you know the energy levels of an atom, you can predict every possible spectral line. Conversely, measuring the spectral lines lets you work backward to determine the energy levels.