In the 1860s, an Augustinian friar named Gregor Mendel spent eight years crossbreeding pea plants in a monastery garden. He tracked seven traits - flower color, seed shape, plant height, and others - across thousands of offspring. What he discovered became the foundation of modern genetics.
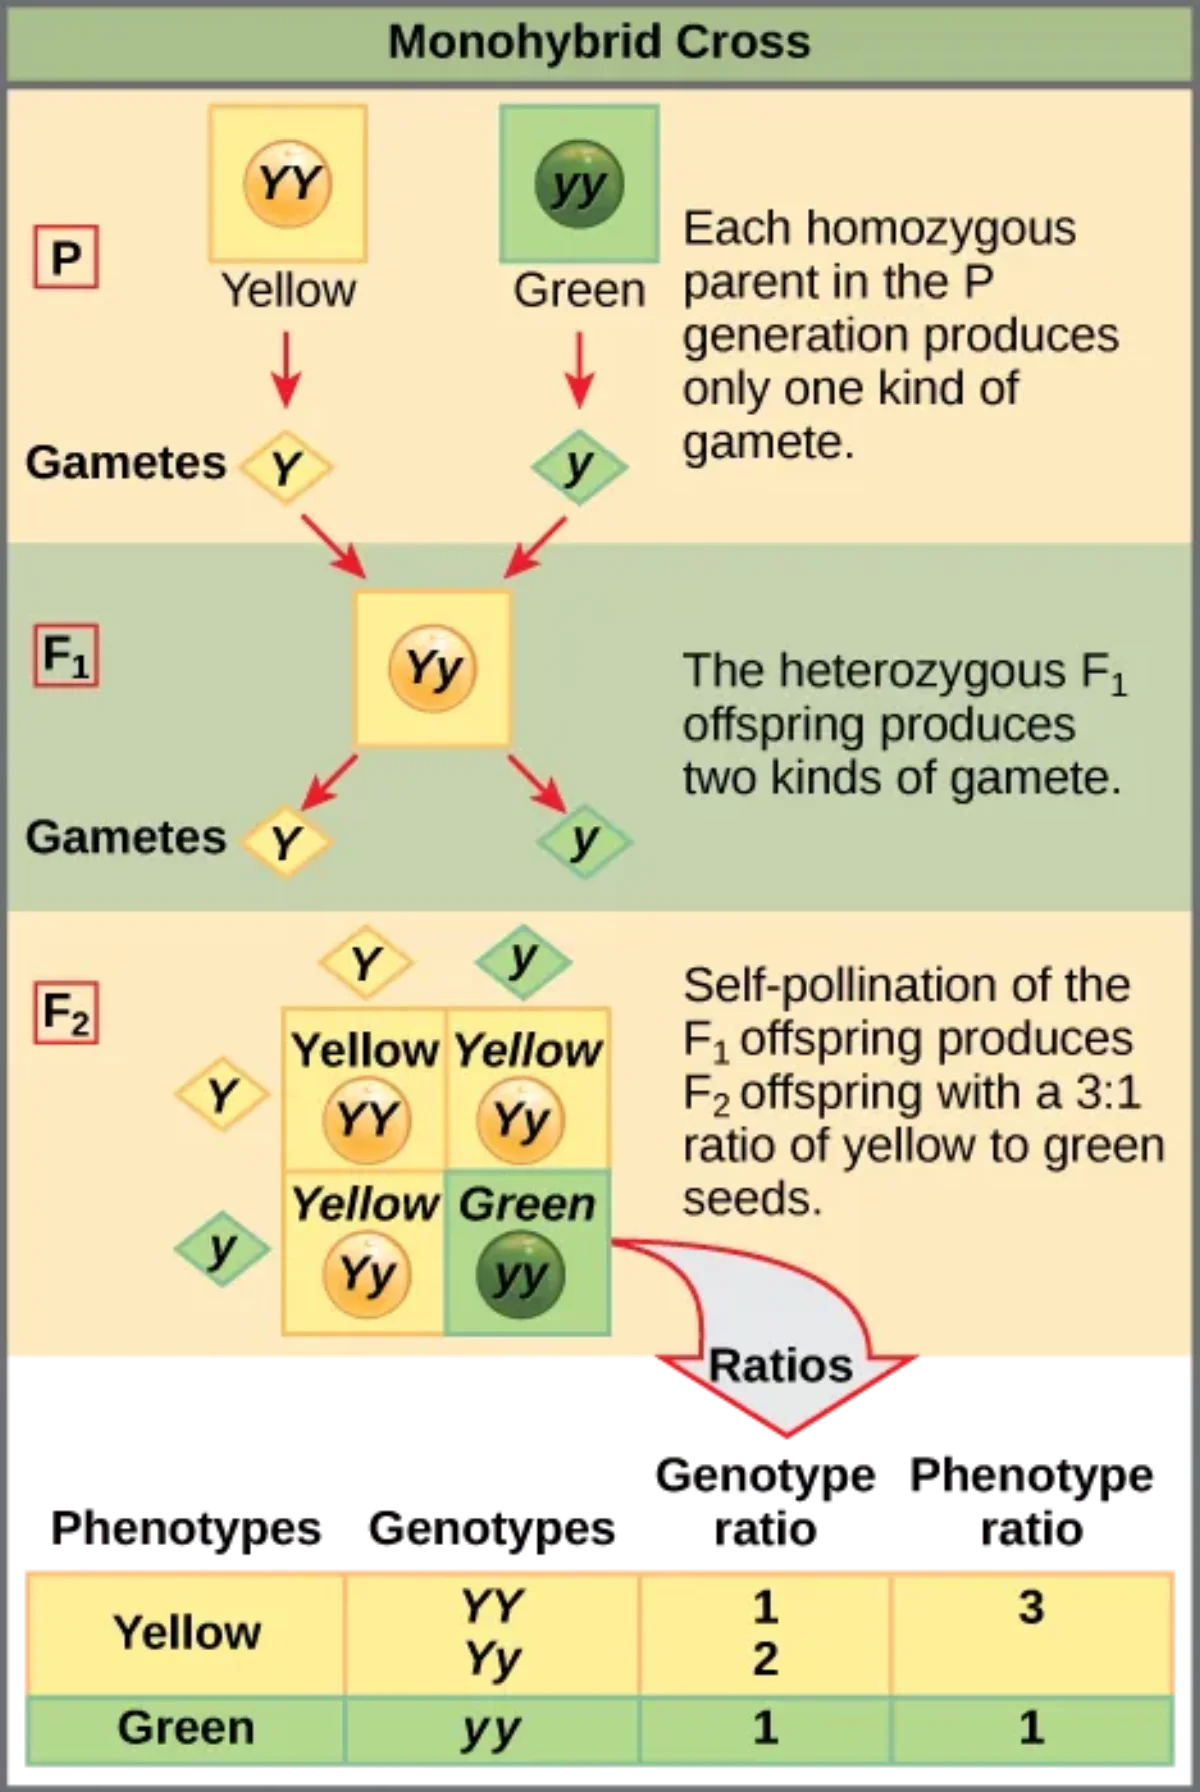
Mendel's law of segregation illustrated with a monohybrid cross. Each parent carries two alleles that separate during gamete formation. The 3:1 phenotypic ratio in the F2 generation is the hallmark of Mendelian single-gene inheritance. Credit: Wikimedia Commons, CC0 Public Domain
Before Mendel, people assumed inheritance was like mixing paint. A tall parent and a short parent should produce medium-height children. Mendel proved this was wrong. Traits do not blend - they are passed as discrete units that we now call genes.
Interactive 3D DNA Double Helix. Rotate to see the sugar-phosphate backbone and complementary base pairs (A-T, G-C) held together by hydrogen bonds.Credit: NaraXR via Sketchfab, CC BY
The Language of Genetics
Before diving into Mendel’s laws, you need the vocabulary. Every genetics question on the MCAT uses these terms.
Term
Definition
Gene
A segment of DNA that codes for a protein or functional RNA
Allele
A specific version of a gene (e.g., “brown eyes” vs. “blue eyes”)
Locus
The physical location of a gene on a chromosome
Genotype
The combination of alleles an individual carries (e.g., Bb)
Phenotype
The observable trait (e.g., brown eyes)
Homozygous
Both alleles are the same (BB or bb)
Heterozygous
The two alleles differ (Bb)
Hemizygous
Only one allele is present (e.g., X-linked genes in males)
Dominant
An allele that determines the phenotype when heterozygous (B in Bb)
Recessive
An allele that is masked in heterozygotes; only expressed when homozygous (bb)
Wild-type
The “normal” allele in a population, often written as +
Mendel’s First Law: The Law of Segregation
Each organism carries two alleles for every gene - one from each parent. During gamete formation (meiosis), these two alleles segregate so that each gamete carries only one allele.
Think about it at the cellular level: homologous chromosomes separate during anaphase I of meiosis. Since each homolog carries one allele for a given gene, the alleles end up in different gametes.
When two gametes fuse at fertilization, the offspring receives one allele from each parent, restoring the pair.
Mendel’s Second Law: The Law of Independent Assortment
Genes on different chromosomes are inherited independently of each other. The allele you inherit for seed shape has no influence on which allele you inherit for flower color - as long as those genes are on separate chromosomes.
This happens because homologous chromosome pairs line up randomly at the metaphase plate during meiosis I. Which maternal chromosome goes to which pole is independent for each pair. With 23 chromosome pairs, there are 223 (over 8 million) possible gamete combinations - and that is before crossing over adds even more variety.
Mendel’s Law of Dominance
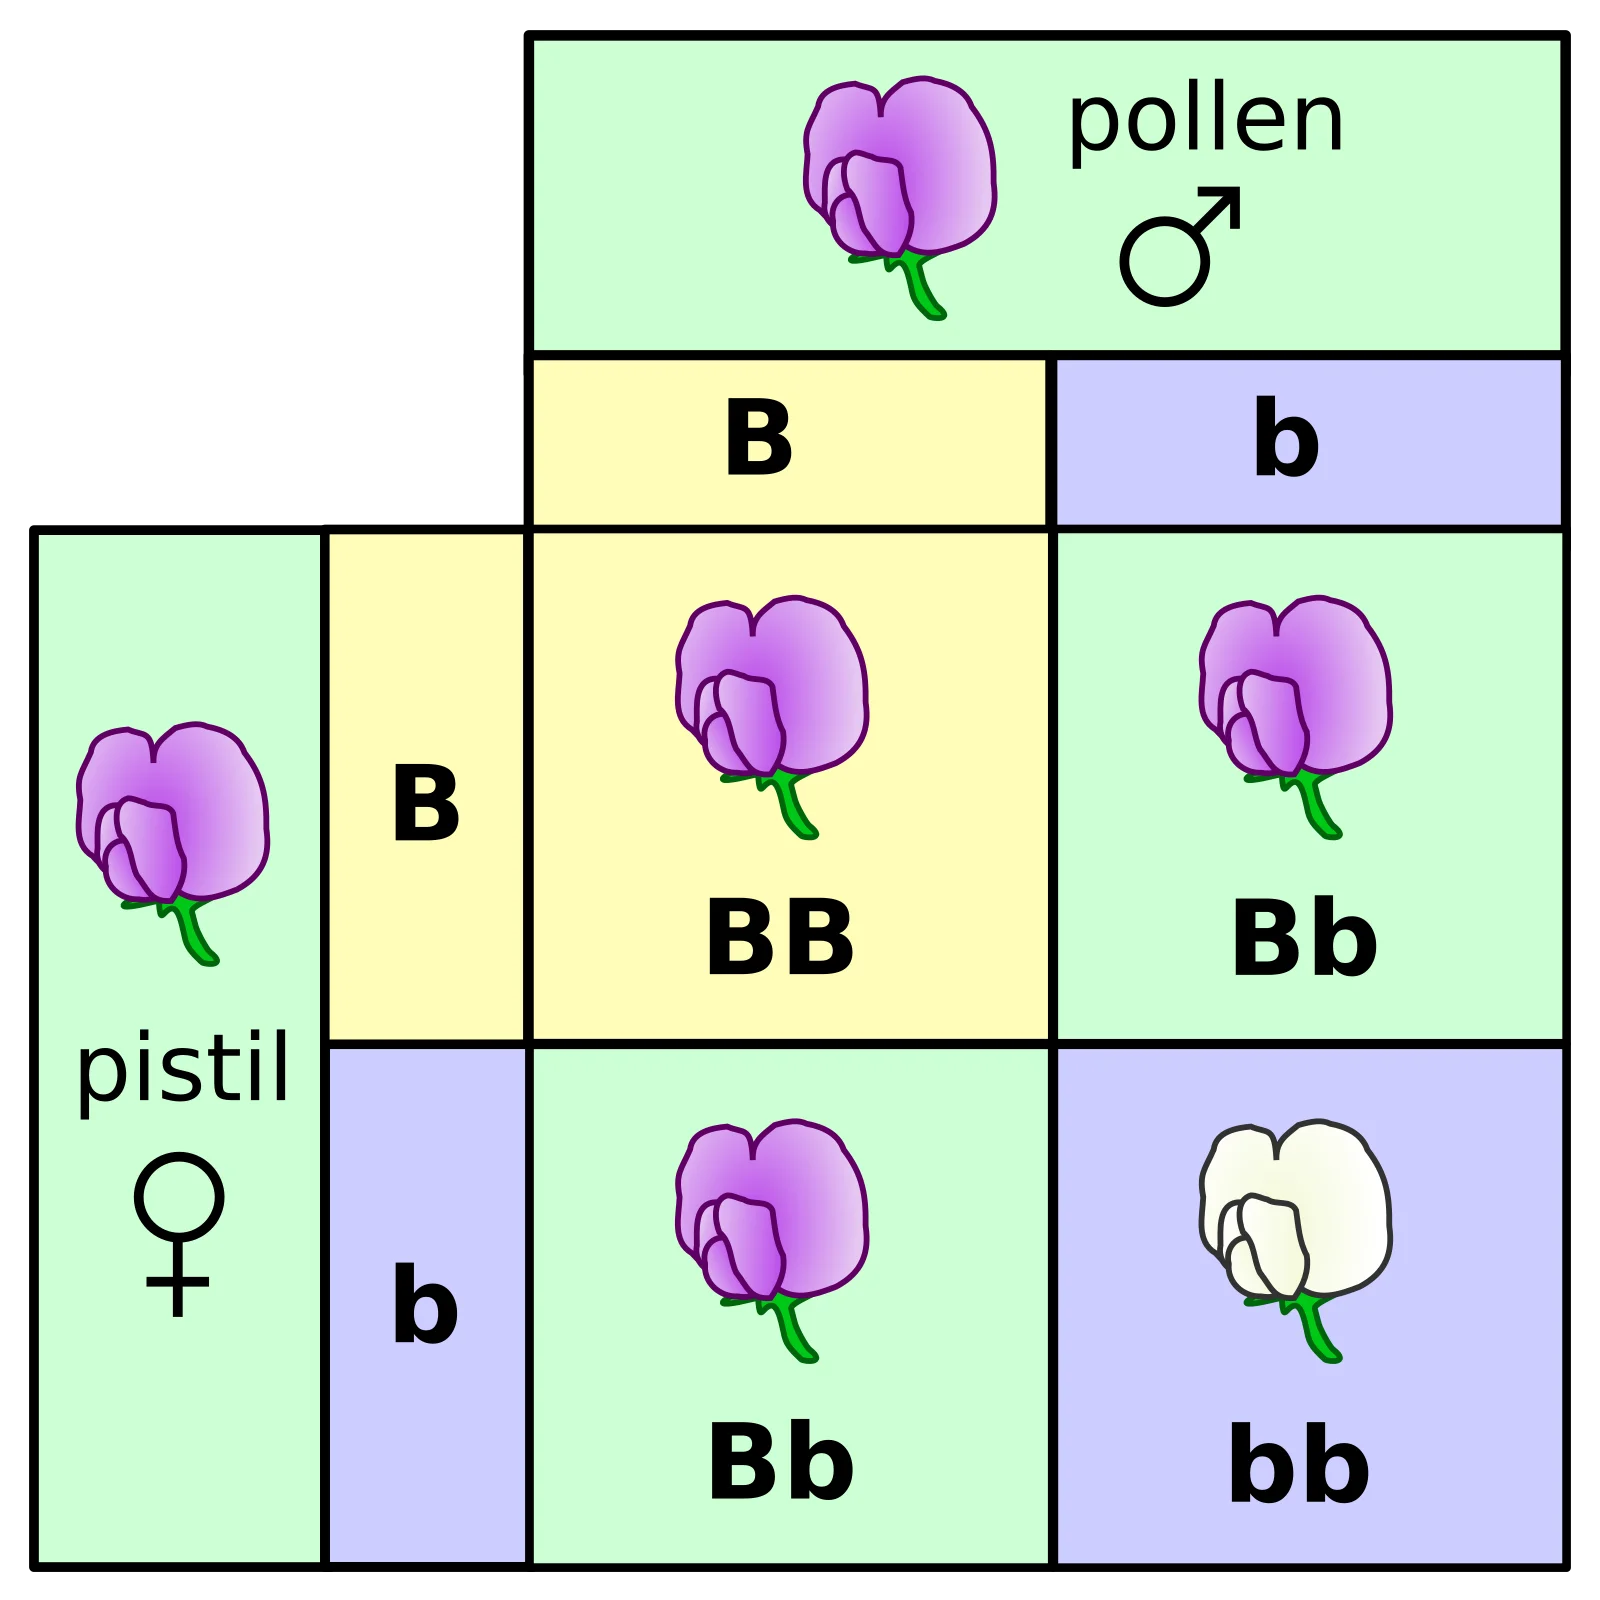
When Mendel crossed true-breeding purple flowers (PP) with true-breeding white flowers (pp), all F1 offspring were purple (Pp). The purple allele completely masked the white allele. He called purple “dominant” and white “recessive.”
When he allowed the F1 generation to self-pollinate (Pp x Pp), the F2 generation showed a 3:1 phenotypic ratio - three purple flowers for every one white flower. The white trait had not disappeared; it was simply hidden in the heterozygotes.
The underlying genotypic ratio in the F2 is 1:2:1 (1 PP : 2 Pp : 1 pp). Both PP and Pp look purple because P is dominant, giving the 3:1 phenotypic ratio.
DNA as Genetic Material
Mendel knew traits were inherited as discrete units, but he did not know what those units were made of. Three key experiments established DNA as the hereditary molecule:
Griffith’s Experiment (1928): Mixed heat-killed virulent (smooth) bacteria with live nonvirulent (rough) bacteria. The rough bacteria were “transformed” into virulent smooth bacteria. Something from the dead bacteria - a “transforming principle” - changed the living ones.
Avery-MacLeod-McCarty (1944): Identified the transforming principle as DNA. When they destroyed the DNA with enzymes, transformation stopped. Destroying proteins or RNA had no effect.
Hershey-Chase (1952): Used bacteriophages labeled with radioactive sulfur (for protein) and radioactive phosphorus (for DNA). Only the phosphorus-labeled DNA entered the bacterial cells and directed the production of new phages. This confirmed DNA - not protein - carries genetic information.
A heterozygous tall plant (Tt) is crossed with a homozygous short plant (tt). What is the expected phenotypic ratio of offspring?
Click to reveal answer
1:1 tall to short. This is a test cross. The Tt parent produces T and t gametes in equal proportions. Combined with only t gametes from the tt parent, you get 50% Tt (tall) and 50% tt (short).
What is the difference between genotype and phenotype?
Click to reveal answer
Genotype is the combination of alleles an organism carries (e.g., Bb). Phenotype is the observable trait that results (e.g., brown eyes). Two organisms can have different genotypes (BB and Bb) but the same phenotype (brown eyes) if the trait shows complete dominance.
Which phase of meiosis directly corresponds to Mendel's Law of Segregation?
Click to reveal answer
Anaphase I. This is when homologous chromosomes (each carrying one allele) are pulled to opposite poles, segregating the two alleles into separate daughter cells.
A Punnett square is nothing more than a multiplication table for alleles. One parent’s possible gametes go across the top. The other parent’s gametes go down the side. Each box represents one possible offspring genotype. If you can multiply, you can do genetics.
The Monohybrid Cross
A monohybrid cross examines the inheritance of a single trait. The classic example is Mendel’s flower color cross.
Cross: Pp x Pp (two heterozygous purple flowers)
P
p
P
PP
Pp
p
Pp
pp
Genotypic ratio: 1 PP : 2 Pp : 1 pp (1:2:1)
Phenotypic ratio: 3 purple : 1 white (3:1)
The 3:1 ratio appears whenever two heterozygotes for a completely dominant trait are crossed. Memorize this ratio - it shows up constantly on the MCAT.
A monohybrid cross between two heterozygous parents produces a 3:1 phenotypic ratio. Credit: OpenStax Biology 2e, CC BY 4.0
The Test Cross
What if you see a tall pea plant but do not know whether its genotype is TT or Tt? Both look the same. To find out, you perform a test cross - crossing the unknown genotype with a homozygous recessive individual (tt).
If the unknown is TT: all offspring are Tt (100% tall)
If the unknown is Tt: offspring are 50% Tt (tall) and 50% tt (short) - a 1:1 ratio
A 1:1 phenotypic ratio in a test cross tells you the unknown parent was heterozygous. Test crosses are also called back crosses.
The Dihybrid Cross
A dihybrid cross tracks two traits simultaneously. This requires a 4x4 Punnett square (16 boxes) because each parent produces four types of gametes.
Example: Cross two plants heterozygous for both flower color (Pp) and plant height (Tt).
Each parent (PpTt) can produce four gamete types: PT, Pt, pT, pt.
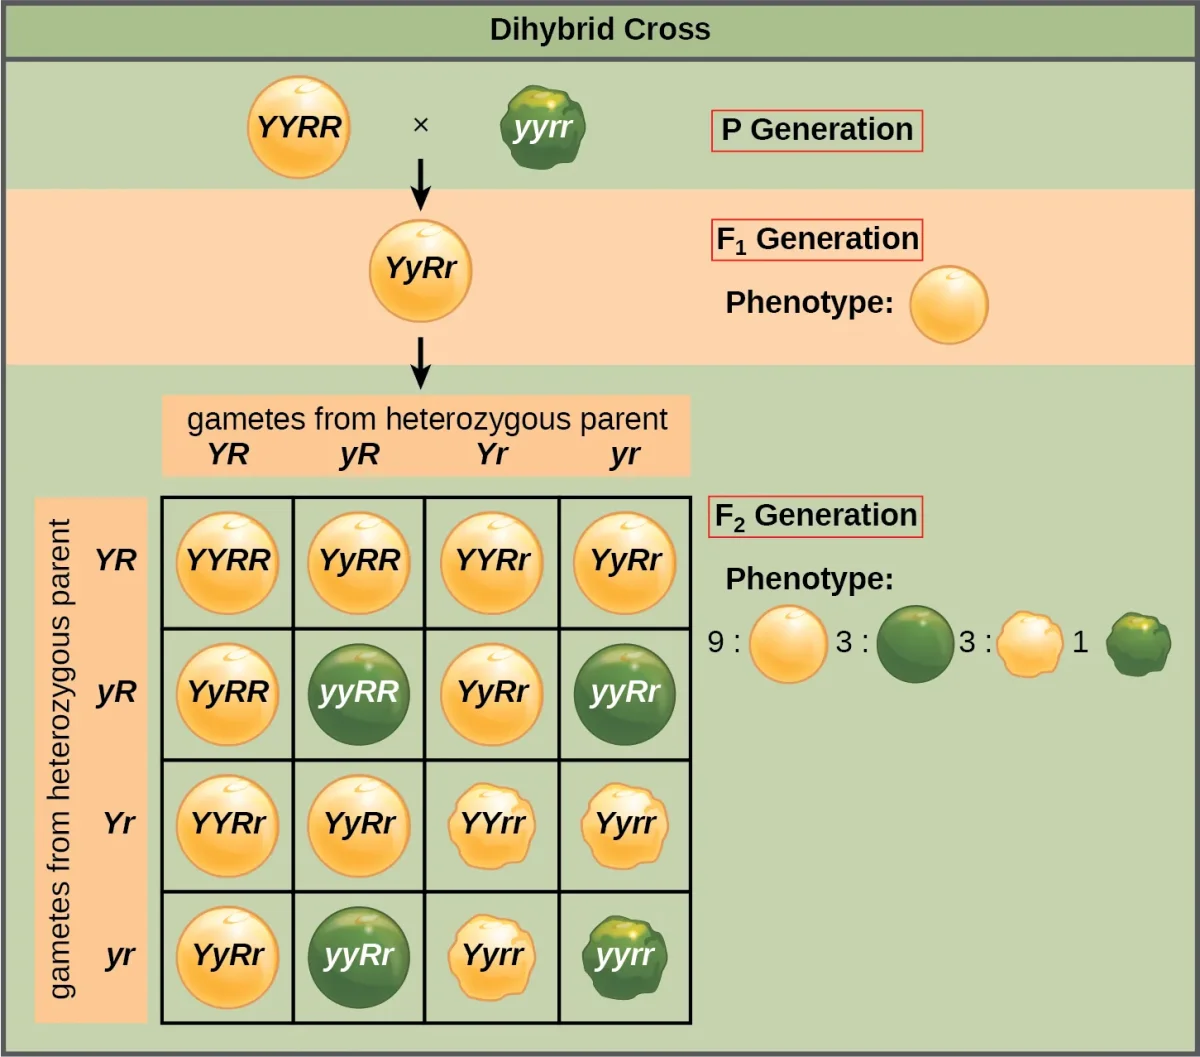
A dihybrid cross between two doubly heterozygous parents produces the classic 9:3:3:1 phenotypic ratio. Credit: OpenStax Biology 2e, CC BY 4.0
The resulting 16-box Punnett square gives the classic 9:3:3:1 phenotypic ratio:
9 purple, tall (at least one P and one T)
3 purple, short (at least one P, homozygous tt)
3 white, tall (homozygous pp, at least one T)
1 white, short (homozygous pp and tt)
Probability Rules
You do not always need to draw a Punnett square. Two probability rules let you solve genetics problems faster:
The Product Rule (AND): The probability of two independent events both occurring is the product of their individual probabilities.
What is the probability of a child being Pp AND Tt from a PpTt x PpTt cross?
P(Pp) = 42 = 21
P(Tt) = 42 = 21
P(Pp AND Tt) = 21 x 21 = 41
The Sum Rule (OR): The probability of one event OR another mutually exclusive event occurring is the sum of their individual probabilities.
What is the probability of a child being homozygous (PP OR pp) from a Pp x Pp cross?
P(PP) = 41
P(pp) = 41
P(PP OR pp) = 41 + 41 = 21
Modified Ratios to Recognize
When you see a ratio that deviates from the expected 9:3:3:1, 3:1, or 1:2:1, it signals non-Mendelian inheritance. We will cover those in the next section, but here are the key modified ratios to watch for:
Observed Ratio
What It Signals
3:1
Standard monohybrid with complete dominance
1:2:1
Incomplete dominance or codominance (three distinct phenotypes)
9:3:3:1
Standard dihybrid with independent assortment
9:3:4
Recessive epistasis (one gene masks another)
9:7
Duplicate recessive epistasis
12:3:1
Dominant epistasis
1:1
Test cross (heterozygous x homozygous recessive)
Chi-Squared: Does the Data Fit the Expected Ratio?
MCAT passages sometimes ask whether observed offspring match a predicted Mendelian ratio. The chi-squared (χ²) goodness-of-fit test is the tool.
You will rarely compute a full χ² on the MCAT, but you may be asked to interpret a p-value. The convention: p < 0.05 rejects the predicted ratio (something non-Mendelian is going on, like linkage or selection); p ≥ 0.05 says the data fit.
In a dihybrid cross between two heterozygotes (AaBb x AaBb), what fraction of offspring are expected to be homozygous recessive for both traits (aabb)?
Click to reveal answer
161. The probability of aa = 41, and the probability of bb = 41. Since the genes assort independently, multiply: 41 x 41 = 161. This is the "1" in the 9:3:3:1 ratio.
You cross a purple-flowered plant of unknown genotype with a white-flowered plant (pp). All 40 offspring are purple. What is the most likely genotype of the unknown parent?
Click to reveal answer
PP (homozygous dominant). If the parent were Pp, you would expect approximately half the offspring to be white (pp). With 40 offspring all being purple, the parent is almost certainly PP. Note: you cannot be 100% certain with a test cross - there is a (21)⁴⁰ chance all 40 offspring happened to inherit P from a Pp parent, but this probability is astronomically small.
Mendel got lucky with his pea plants. Every trait he studied showed clean, complete dominance - one allele fully masked the other. But most real-world traits are messier. Sometimes neither allele wins. Sometimes both show up. Sometimes one gene blocks another gene entirely. These “exceptions” to Mendel’s rules are collectively called non-Mendelian inheritance, and they are heavily tested on the MCAT.
Incomplete Dominance
In incomplete dominance, the heterozygote phenotype is a blend of the two homozygous phenotypes. Neither allele is fully dominant.
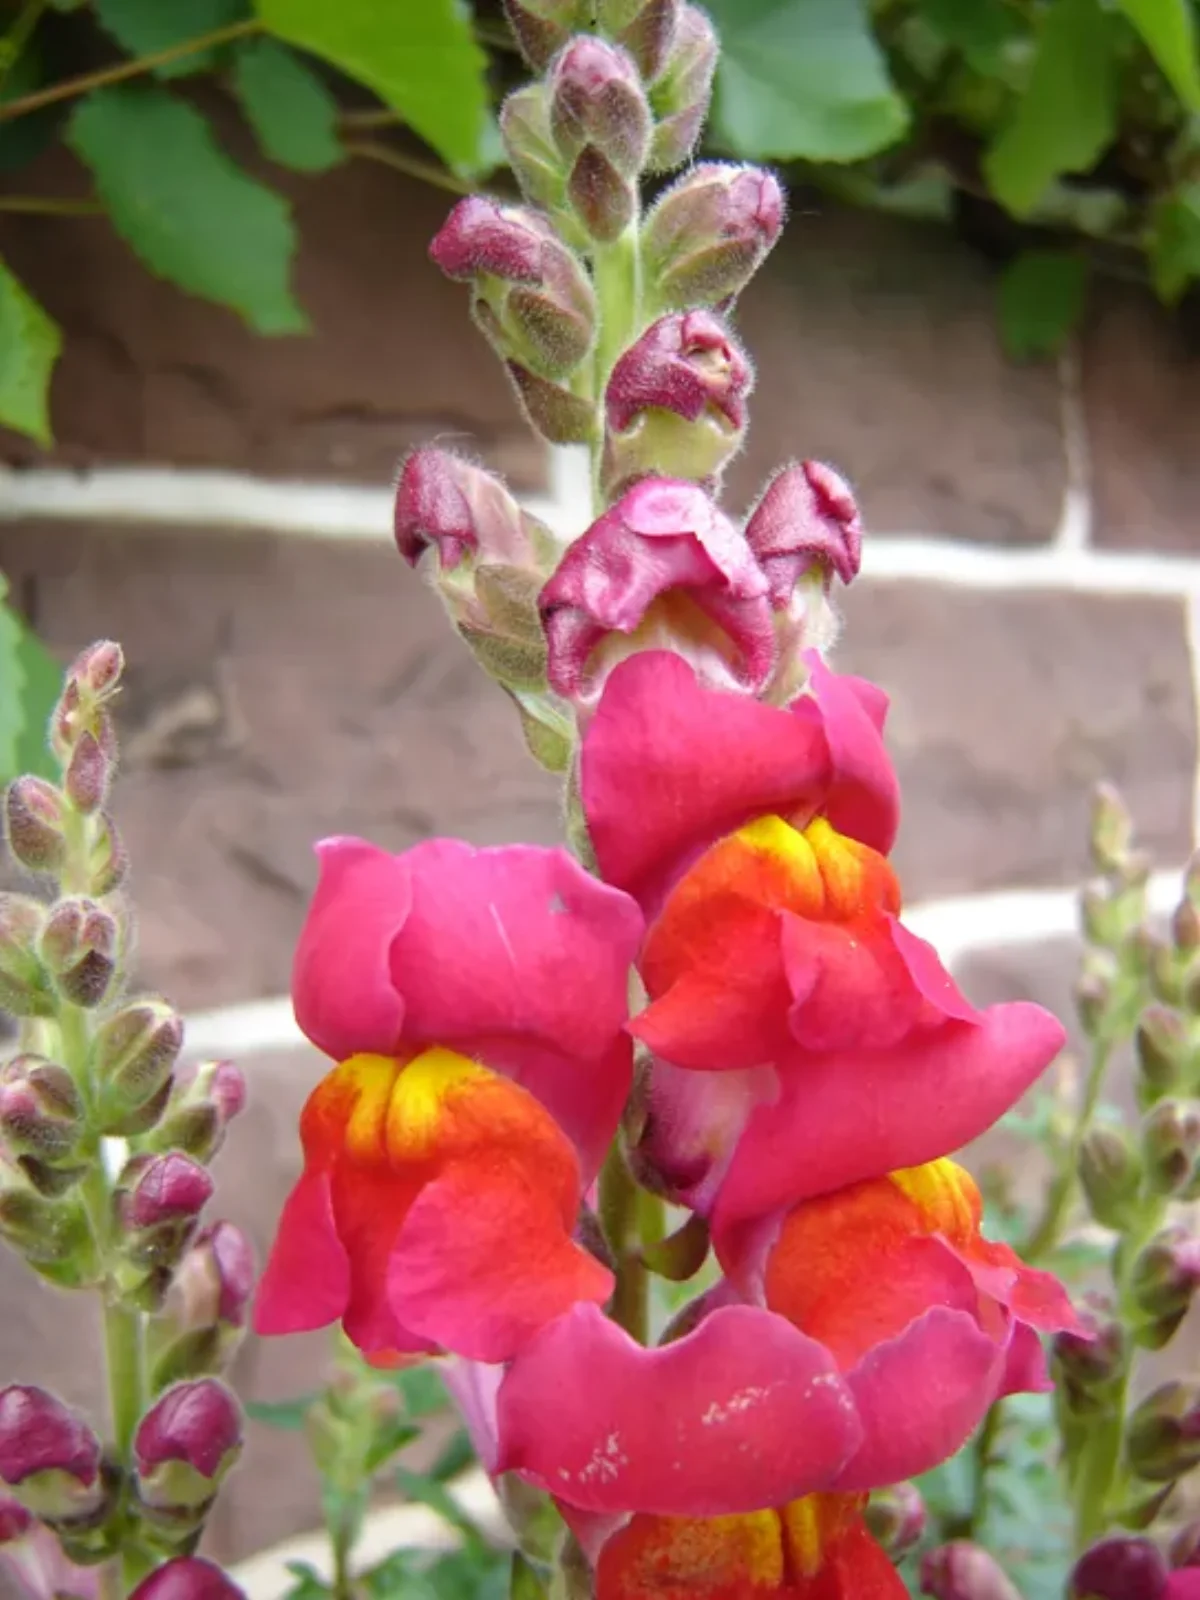
The classic example is snapdragon flower color:
RR = red flowers
rr = white flowers
Rr = pink flowers (intermediate)
The F2 ratio from crossing two heterozygotes (Rr x Rr) is 1:2:1 - one red, two pink, one white. Notice the phenotypic ratio equals the genotypic ratio because you can distinguish all three genotypes by phenotype.
Incomplete dominance in snapdragons: crossing red (RR) and white (rr) produces pink (Rr) heterozygotes. The F2 generation shows a 1:2:1 ratio. Credit: OpenStax Biology 2e, CC BY 4.0
Codominance
In codominance, both alleles are fully expressed simultaneously in the heterozygote. There is no blending - both phenotypes appear side by side.
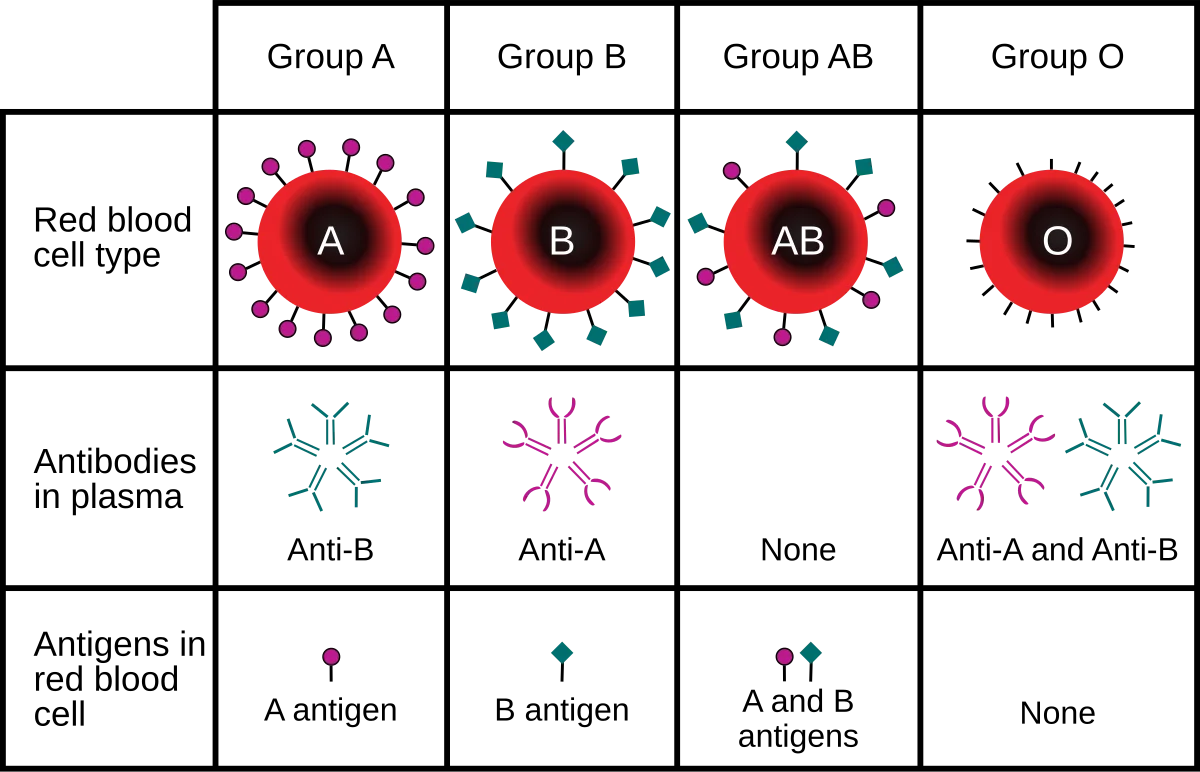
The most important example for the MCAT is the ABO blood type system:
Genotype
Antigens on RBCs
Blood Type
Antibodies in Plasma
IAIA or IA i
A antigen
Type A
Anti-B
IBIB or IB i
B antigen
Type B
Anti-A
IAIB
Both A and B antigens
Type AB
Neither
ii
No antigens
Type O
Both Anti-A and Anti-B
The IA and IB alleles are codominant with each other - a person with genotype IAIB expresses both A and B antigens. Both IA and IB are dominant over i, which produces no antigen.
This system also illustrates multiple alleles - there are three possible alleles (IA, IB, i) in the population, though any individual can only carry two.
The ABO blood type system demonstrates both codominance (IA and IB) and multiple alleles (three alleles in the population). Credit: Wikimedia Commons, CC BY-SA 3.0
Epistasis
Epistasis occurs when one gene controls or masks the expression of a different gene at a separate locus. The gene doing the masking is called the epistatic gene; the gene being masked is the hypostatic gene.
A classic example is coat color in Labrador retrievers:
Gene E/e controls whether pigment is deposited at all
Gene B/b determines whether the pigment is black or brown
ee dogs are yellow regardless of their B genotype - the E gene is epistatic to B
If you cross two EeBb dogs, the expected 9:3:3:1 ratio becomes 9:3:4 because the 3 + 1 (both ee groups) are combined into a single yellow phenotype.
Polygenic Inheritance
Some traits are controlled by multiple genes, each contributing a small additive effect. These traits show a continuous distribution (bell curve) rather than distinct categories.
Because many genes contribute, polygenic traits are strongly influenced by environmental factors. Height is polygenic, but nutrition also plays a major role - this is the nature vs. nurture interaction.
Pleiotropy
Pleiotropy is the opposite of polygenic inheritance: one gene influences multiple, seemingly unrelated traits.
The best MCAT example is sickle cell disease. A single point mutation in the hemoglobin gene causes:
Sickle-shaped red blood cells
Anemia
Organ damage from blocked capillaries
Resistance to malaria (in heterozygotes)
One gene, many phenotypic effects.
Penetrance and Expressivity
These two concepts describe how consistently a genotype produces its expected phenotype:
Penetrance = the percentage of individuals with a given genotype who actually show the phenotype.
Complete penetrance (100%): Everyone with the genotype shows the phenotype (e.g., Huntington’s disease - if you carry the expanded repeat, you will develop symptoms)
Incomplete penetrance: Not everyone with the genotype shows the phenotype (e.g., BRCA1 mutations increase breast cancer risk but not all carriers develop cancer)
Expressivity = the degree to which a phenotype is expressed among individuals who do show it.
Constant expressivity: Everyone who expresses the trait shows it the same way
Variable expressivity: The severity differs between individuals (e.g., neurofibromatosis type 1 - some patients have mild skin spots, others have debilitating tumors)
Genomic Imprinting
In imprinting, only the allele from one parent is expressed; the other is chemically silenced (methylated) during gamete formation. So phenotype depends on which parent contributed which allele, not just the genotype itself.
If the active copy is deleted or mutated, the silenced copy cannot compensate. Prader-Willi syndrome results from loss of the paternal copy of a region on chromosome 15; Angelman syndrome results from loss of the maternal copy of the same region. Same DNA region, different phenotypes, based entirely on parental origin.
Mitochondrial Inheritance
Not all genes are in the nucleus. Mitochondria contain their own circular DNA (mtDNA), which is inherited exclusively from the mother. Sperm contribute essentially no mitochondria at fertilization.
Key features of mitochondrial inheritance:
Affected mothers pass the trait to all children (sons and daughters)
Affected fathers pass the trait to no children
There is no carrier state - you either have the mutation or you do not
mtDNA does not follow dominant/recessive rules
A couple has blood types A (IA i) and B (IB i). What blood types are possible in their children?
Click to reveal answer
All four blood types are possible: Type AB (IAIB), Type A (IA i), Type B (IB i), and Type O (ii). This cross produces a 1:1:1:1 ratio of blood types.
How does epistasis differ from dominance?
Click to reveal answer
Dominance is a relationship between two alleles of the SAME gene (one masks the other at the same locus). Epistasis is a relationship between two DIFFERENT genes (one gene masks the expression of a gene at a different locus). Dominance: B vs. b. Epistasis: Gene E masks Gene B.
Humans have 22 pairs of autosomes (non-sex chromosomes) and one pair of sex chromosomes. Females are XX. Males are XY. This unequal setup creates unique inheritance patterns for genes on the X and Y chromosomes.
Sex Determination
The SRY gene on the Y chromosome is the master switch for male development. It triggers testis formation, which leads to testosterone production and male sex characteristics. Without SRY, the default developmental pathway is female.
X-Linked Recessive Inheritance
The X chromosome carries hundreds of genes. Males have only one X, so they express whatever allele is on it - they are hemizygous for X-linked genes. Females have two X chromosomes, so they can be carriers (heterozygous) without showing symptoms.
Key features of X-linked recessive traits:
Affected individuals are almost always male (one bad copy is enough)
Carrier females (XAXa) are usually unaffected but can pass the allele to sons
Affected fathers cannot pass the trait to sons (fathers give Y to sons, not X)
All daughters of an affected father are at least carriers (they inherit his X)
Classic examples: hemophilia A, red-green color blindness, Duchenne muscular dystrophy.
X-Linked Dominant Inheritance
X-linked dominant traits are expressed in both males AND females who carry even one copy. However, because females have two X chromosomes and X-inactivation occurs randomly, affected females may show milder or more variable symptoms than affected males.
Key features:
Affected fathers pass the trait to ALL daughters (they all get his X) but NO sons (they get Y)
Affected mothers pass the trait to approximately half of all children regardless of sex
Both males and females are affected, but females may show variable expressivity
Y-Linked Inheritance
The Y chromosome is small and carries very few genes (about 50-60 protein-coding genes). Y-linked traits pass exclusively from father to son.
The most important Y-linked gene is SRY (sex-determining region Y). Y-linked traits are rare and always appear in all male descendants of an affected father.
X-Inactivation and Barr Bodies
Females have twice as many X-linked genes as males. To balance gene dosage, each female cell randomly inactivates one X chromosome early in embryonic development. The inactivated X condenses into a Barr body - a dark, inactive clump visible at the edge of the nucleus.
This process is random: in some cells the maternal X is active, in others the paternal X is active. The result is a mosaic of two cell populations.
The classic example is the calico cat. Coat color is X-linked, with one allele for orange and one for black. A heterozygous female (XOXB) randomly inactivates one X in each patch of skin, producing a patchwork of orange and black fur. Male cats (XY) can only be orange or black, never calico.
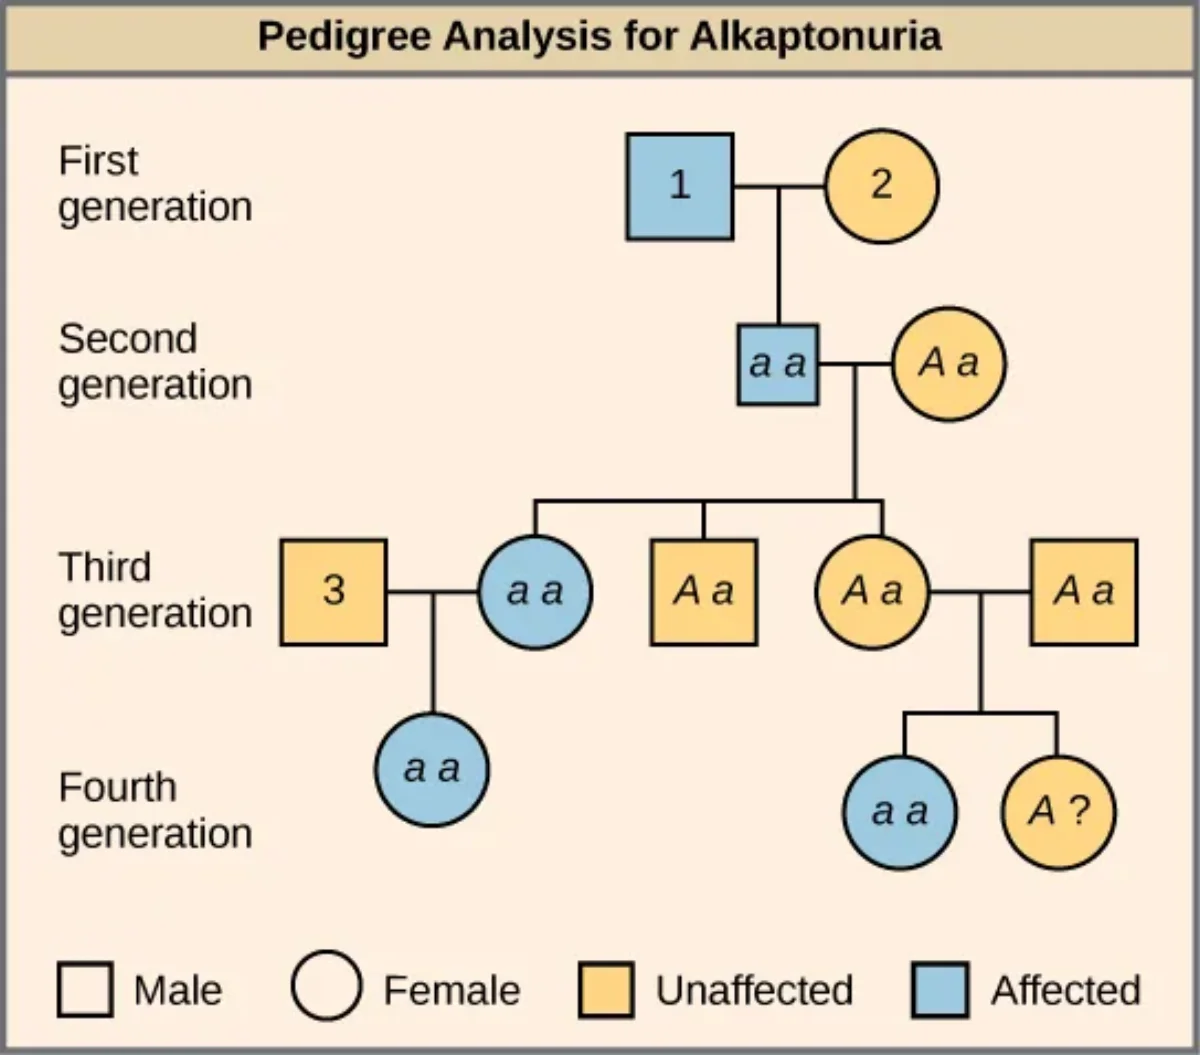
Pedigree Analysis
A pedigree is a family tree that tracks a trait across generations. The MCAT expects you to look at a pedigree and determine the most likely inheritance pattern.
Pedigree symbols:
Circles = female, Squares = male
Filled = affected, Open = unaffected
Half-filled = carrier (for recessive traits)
Horizontal line = mating pair
Vertical line = parent-to-offspring connection
A pedigree showing autosomal recessive inheritance. Squares are males, circles are females. Filled symbols indicate affected individuals. Credit: OpenStax Biology 2e, CC BY 4.0
How to Read a Pedigree
Use this decision tree:
Step 1: Is it dominant or recessive?
If two unaffected parents have an affected child, the trait is recessive (both parents must be carriers)
If every affected individual has at least one affected parent, the trait is likely dominant
Step 2: Is it autosomal or X-linked?
If affected fathers have affected sons, it is NOT X-linked (must be autosomal)
If the trait appears much more frequently in males, consider X-linked recessive
If an affected father passes the trait to ALL daughters, consider X-linked dominant
Quick Reference: Inheritance Pattern Clues
Pattern
Key Clues
Autosomal Dominant
Affected in every generation; affected individual has at least one affected parent; males and females equally affected
Autosomal Recessive
Can skip generations; unaffected parents can have affected children; males and females equally affected
X-linked Recessive
More males affected; carrier mothers pass to sons; affected fathers have carrier daughters but unaffected sons
X-linked Dominant
Affected fathers pass to ALL daughters but NO sons; affected mothers pass to ~50% of children
Mitochondrial
Maternal inheritance only; affected mother passes to all children; affected father passes to none
A color-blind man (Xb Y) has children with a carrier woman (XBXb). What fraction of their sons will be color blind?
Click to reveal answer
21. Sons get Y from the father and X from the mother. The mother is XBXb, so half her X gametes carry Xb. Half the sons will be Xb Y (color blind) and half will be XB Y (normal vision).
In a pedigree, two unaffected parents have an affected daughter. What inheritance patterns are possible?
Click to reveal answer
Autosomal recessive. Both parents must be carriers (Aa x Aa) to produce an affected daughter (aa). X-linked recessive is ruled out because the daughter is affected - she would need two copies of the recessive allele, meaning the father would also need to be affected (Xa Y). Since the father is unaffected, this cannot be X-linked recessive.
Mendel’s law of independent assortment works perfectly - as long as the two genes are on different chromosomes. But what happens when two genes sit on the same chromosome? They tend to be inherited together, violating independent assortment. This is called genetic linkage.
Linked Genes and Parental Types
When two genes are linked (on the same chromosome), the allele combinations inherited from each parent tend to stay together. These original combinations are called parental types.
For example, if a parent has alleles AB on one chromosome and ab on the homolog, most gametes will be either AB or ab (parental types), not Ab or aB.
If genes were truly unlinked, a dihybrid test cross (AaBb x aabb) would produce offspring in a 1:1:1:1 ratio. Linked genes deviate from this ratio - parental types are overrepresented.
Crossing Over Creates Recombinants
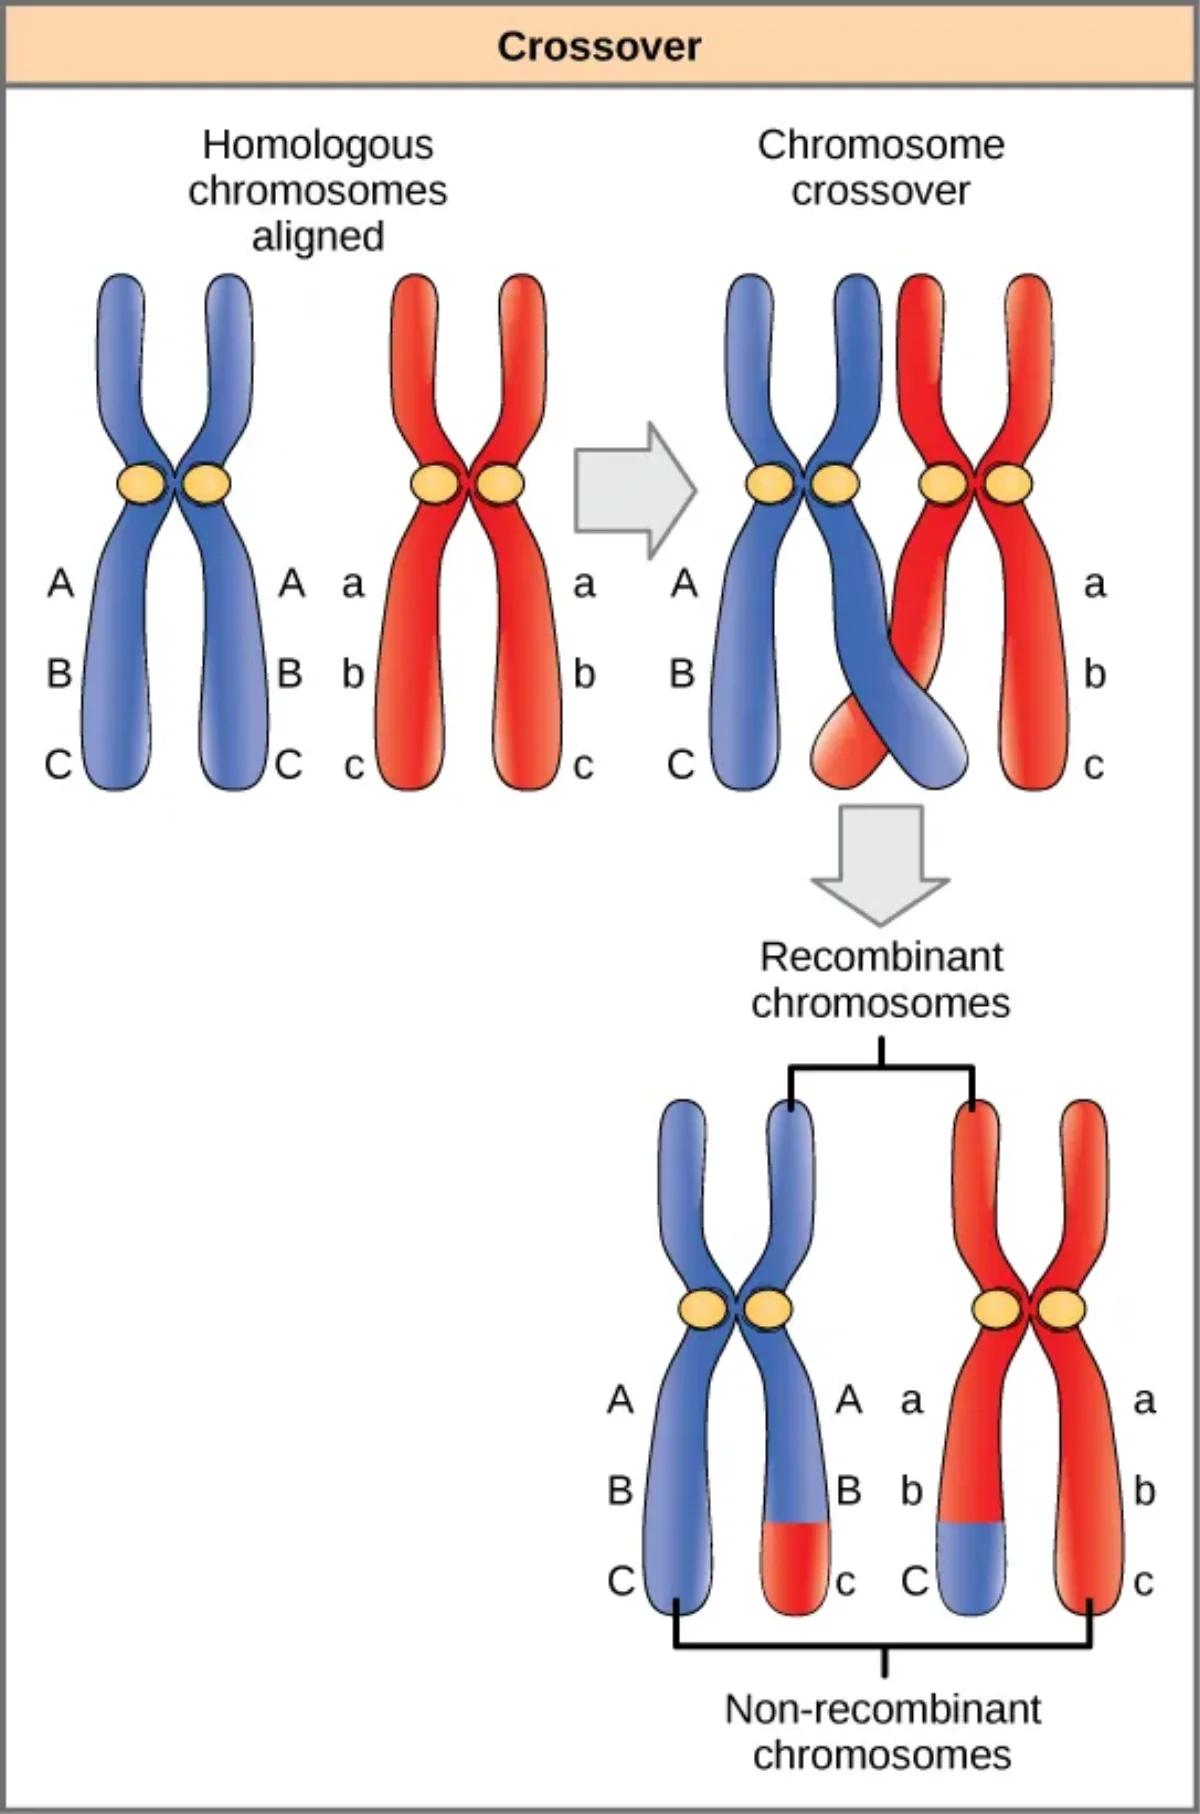
During prophase I of meiosis, homologous chromosomes pair up and exchange segments of DNA. This is crossing over (recombination). If a crossover event occurs between two linked genes, it separates them into new allele combinations called recombinant types.
The closer two genes are on a chromosome, the less likely crossing over will occur between them. Genes that are far apart on the same chromosome are crossed over so frequently that they behave as if they are on different chromosomes.
Crossing over during prophase I of meiosis exchanges segments between homologous chromosomes, creating recombinant gametes. Credit: OpenStax Biology 2e, CC BY 4.0
Recombination Frequency
Recombination frequency measures how often crossover produces recombinant offspring. It is calculated as:
Key facts about recombination frequency:
RF = 0% means the genes are completely linked (no crossover ever separates them)
RF = 50% means the genes assort independently (either on different chromosomes or very far apart on the same chromosome)
RF can never exceed 50% because at most, half the gametes from a single meiosis can be recombinant
Gene Mapping
By measuring recombination frequencies between pairs of genes, you can determine their relative positions on a chromosome. This is called gene mapping.
Example: Three genes - A, B, and C - have the following RFs:
A-B: 8 cM
B-C: 5 cM
A-C: 13 cM
Since 8 + 5 = 13, the order must be A - B - C, with B in the middle.
If the numbers do not add up perfectly (e.g., A-C = 12 instead of 13), the discrepancy is due to double crossovers between A and C, which can restore the parental arrangement and make the apparent distance slightly smaller than the true distance.
A test cross produces 410 parental-type offspring and 90 recombinant offspring. What is the recombination frequency, and how far apart are the genes?
Click to reveal answer
RF = 50090 = 18%. The two genes are 18 map units (18 cM) apart on the same chromosome. Since RF is well below 50%, the genes are linked but not extremely close.
Can the recombination frequency between two genes ever exceed 50%? Why or why not?
Click to reveal answer
No. A maximum of 50% of gametes from a single meiosis can be recombinant (the other 50% are parental). Even genes on different chromosomes produce exactly 50% recombinant offspring. RF greater than 50% would imply more recombinants than parentals, which is physically impossible.
All genetic variation begins with mutations - changes to the DNA sequence. Some mutations are harmless. Some are lethal. A rare few are beneficial. Together, they provide the raw material for evolution and are the reason no two individuals (except identical twins) have the exact same genome.
The detailed molecular mechanisms of mutation, DNA repair, and replication are covered in the Biochemistry book (Chapters 6-7). Here we focus on the types of mutations, their consequences, and how they change the composition of a population’s gene pool - the total collection of alleles in a population.
Point Mutations
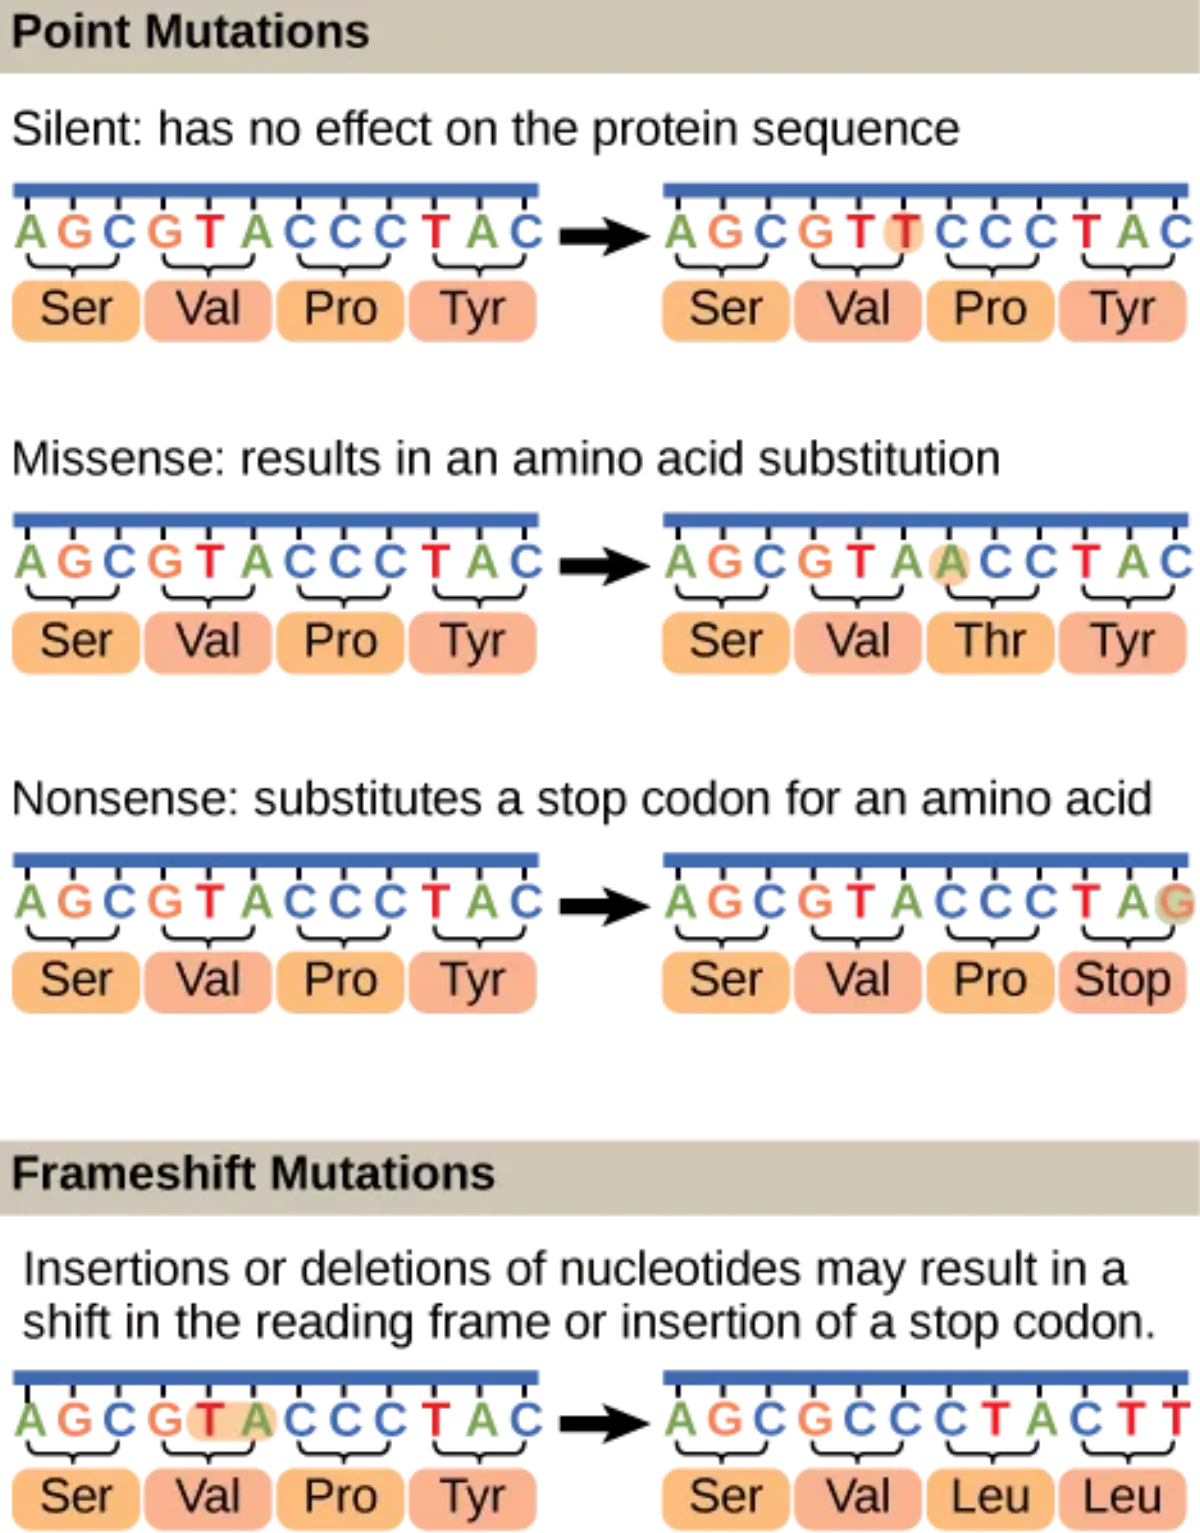
A point mutation changes a single nucleotide in the DNA sequence. There are three types:
Silent mutation: The nucleotide change does not alter the amino acid. This happens because the genetic code is degenerate - multiple codons code for the same amino acid, especially at the third (wobble) position.
Missense mutation: The change produces a different amino acid. The effect ranges from harmless (conservative substitution of a similar amino acid) to devastating. The classic example is sickle cell disease: a single A-to-T substitution changes glutamic acid to valine in hemoglobin, causing red blood cells to sickle.
Nonsense mutation: The change creates a premature stop codon, producing a truncated, usually nonfunctional protein.
Trinucleotide repeat expansion: A short DNA sequence (e.g., CAG) is repeated many extra times during replication. Each generation can add more repeats, so the disease often worsens or appears earlier (anticipation). Examples: Huntington’s disease (CAG) and fragile X syndrome (CGG).
Types of point mutations and their effects on the amino acid sequence. Silent mutations cause no change, missense mutations swap one amino acid, nonsense mutations create a premature stop codon, and frameshift mutations alter every downstream amino acid. Credit: OpenStax Biology 2e, CC BY 4.0
Frameshift Mutations
Insertions or deletions of nucleotides (in numbers that are NOT multiples of 3) shift the reading frame of the mRNA. Every codon downstream of the mutation is read incorrectly, usually producing a completely nonfunctional protein.
Insertions and deletions that ARE multiples of 3 add or remove whole amino acids without disrupting the reading frame - these are non-frameshift insertions/deletions.
Chromosomal Mutations
Larger-scale changes can affect entire segments of chromosomes:
Type
What Happens
Example
Deletion
A segment is lost
Cri du chat syndrome (5p deletion)
Duplication
A segment is copied
Some cancers (gene amplification)
Inversion
A segment is flipped 180 degrees
Usually silent but can affect fertility
Insertion
A segment moves to a new location
Some cancers
Translocation
Segments swap between non-homologous chromosomes
Philadelphia chromosome (CML)
Aneuploidy - having an abnormal number of chromosomes - results from nondisjunction during meiosis. Homologous chromosomes (meiosis I) or sister chromatids (meiosis II) fail to separate properly.
Condition
Chromosome Change
Features
Down syndrome
Trisomy 21
Most common viable autosomal trisomy
Turner syndrome
Monosomy X (45,X)
Female, short stature, ovarian failure
Klinefelter syndrome
47,XXY
Male, tall, possible infertility
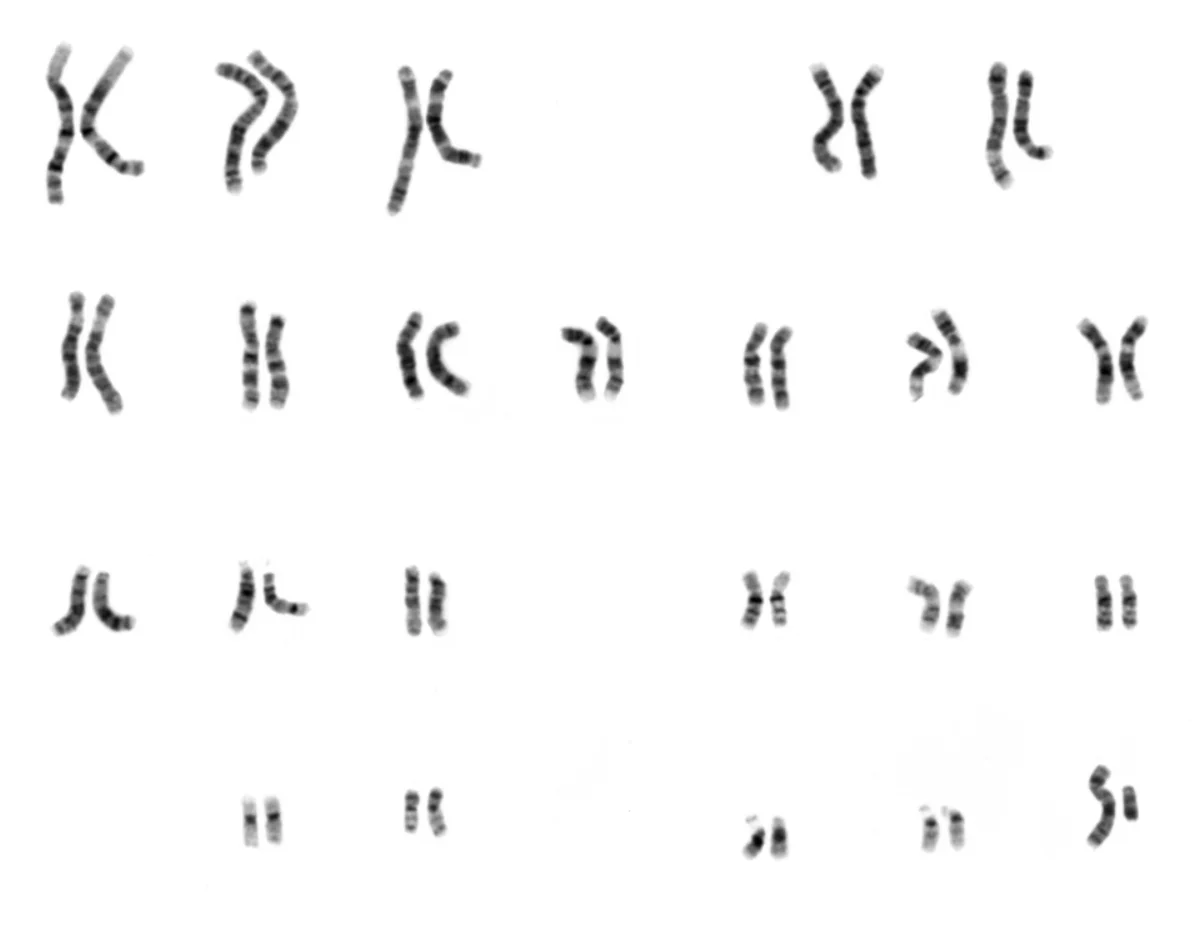
A normal human male karyotype (46,XY). Chromosomes are arranged in pairs from largest to smallest. Trisomy would show three copies of one chromosome instead of two. Credit: NHGRI, public domain
Consequences of Mutations
Mutations can be:
Neutral - no effect on fitness (most mutations fall here, especially in non-coding DNA)
Beneficial - confer a selective advantage (e.g., heterozygous sickle cell trait protects against malaria)
Deleterious - reduce fitness or cause disease
Germline mutations occur in eggs or sperm and are passed to offspring. Somatic mutations occur in body cells and are NOT inherited but can cause diseases like cancer in the affected individual.
Mutagens
Mutagens are environmental agents that increase mutation rates:
Chemical mutagens: Alkylating agents, base analogs, intercalating agents (e.g., benzopyrene in cigarette smoke)
Biological mutagens: Certain viruses insert into the host genome
All carcinogens are mutagens, but not all mutagens are carcinogens. A mutagen becomes a carcinogen when it causes mutations in genes controlling cell growth (proto-oncogenes, tumor suppressors).
Changes in the Gene Pool
The gene pool is the total collection of alleles in a population. Several forces change allele frequencies over time:
Genetic Drift
Genetic drift is a random change in allele frequencies, most significant in small populations. By chance, some alleles may become more or less common - not because they are beneficial or harmful, but simply due to random sampling.
Two special cases of genetic drift:
Bottleneck effect: A catastrophic event (natural disaster, epidemic) kills a large portion of the population at random. The surviving population’s gene pool may differ dramatically from the original.
Founder effect: A small group splits off from a larger population and starts a new colony. The founders carry only a subset of the original alleles, so rare alleles may be overrepresented. This explains why some rare diseases are unusually common in certain isolated communities.
Gene Flow (Genetic Leakage)
Gene flow is the movement of alleles between populations through migration. It tends to reduce genetic differences between populations. When individuals from one population breed with another population, they introduce new alleles.
Inbreeding
Inbreeding is mating between close relatives. It does not change allele frequencies, but it increases homozygosity. This can expose harmful recessive alleles, leading to inbreeding depression - reduced fitness in a population with high levels of inbreeding.
The opposite - outbreeding (mating between unrelated individuals) - increases heterozygosity and can increase a population’s fitness.
A single nucleotide deletion at position 5 of a coding sequence will have what type of effect on the protein?
Click to reveal answer
Frameshift mutation. Since one nucleotide (not a multiple of 3) is deleted, every codon after position 5 will be read incorrectly. The resulting protein will likely be completely nonfunctional, possibly truncated by a premature stop codon created by the shifted reading frame.
Why is genetic drift more significant in small populations than large ones?
Click to reveal answer
In large populations, random fluctuations in allele frequency are averaged out across many individuals. In small populations, chance events (which alleles happen to be passed on) can dramatically shift allele frequencies in a single generation. A single death or failure to reproduce can eliminate a rare allele entirely.
Evolution is the change in allele frequencies in a population over time. That is it. It is not “progress” or “improvement” - it is simply that some alleles become more or less common from one generation to the next. The mechanisms that drive these changes include natural selection, genetic drift, gene flow, and mutation.
Natural Selection
Natural selection is the process by which organisms with traits better suited to their environment survive and reproduce more successfully. Over generations, the alleles responsible for those advantageous traits increase in frequency.
Four conditions are required for natural selection:
Variation exists in the population (different alleles for a trait)
The variation is heritable (genetically based, not just environmental)
There is a differential in reproductive success (some individuals produce more offspring)
The variation affects fitness (the ability to survive and reproduce in a given environment)
Fitness in evolution does not mean “strongest” or “fastest.” It means reproductive success - how many viable, fertile offspring an organism produces. A scrawny bird that raises six chicks has higher fitness than a powerful bird that raises one.
Three Types of Natural Selection
Natural selection does not always push a population in one direction. Depending on the environment, it can act in three different patterns:
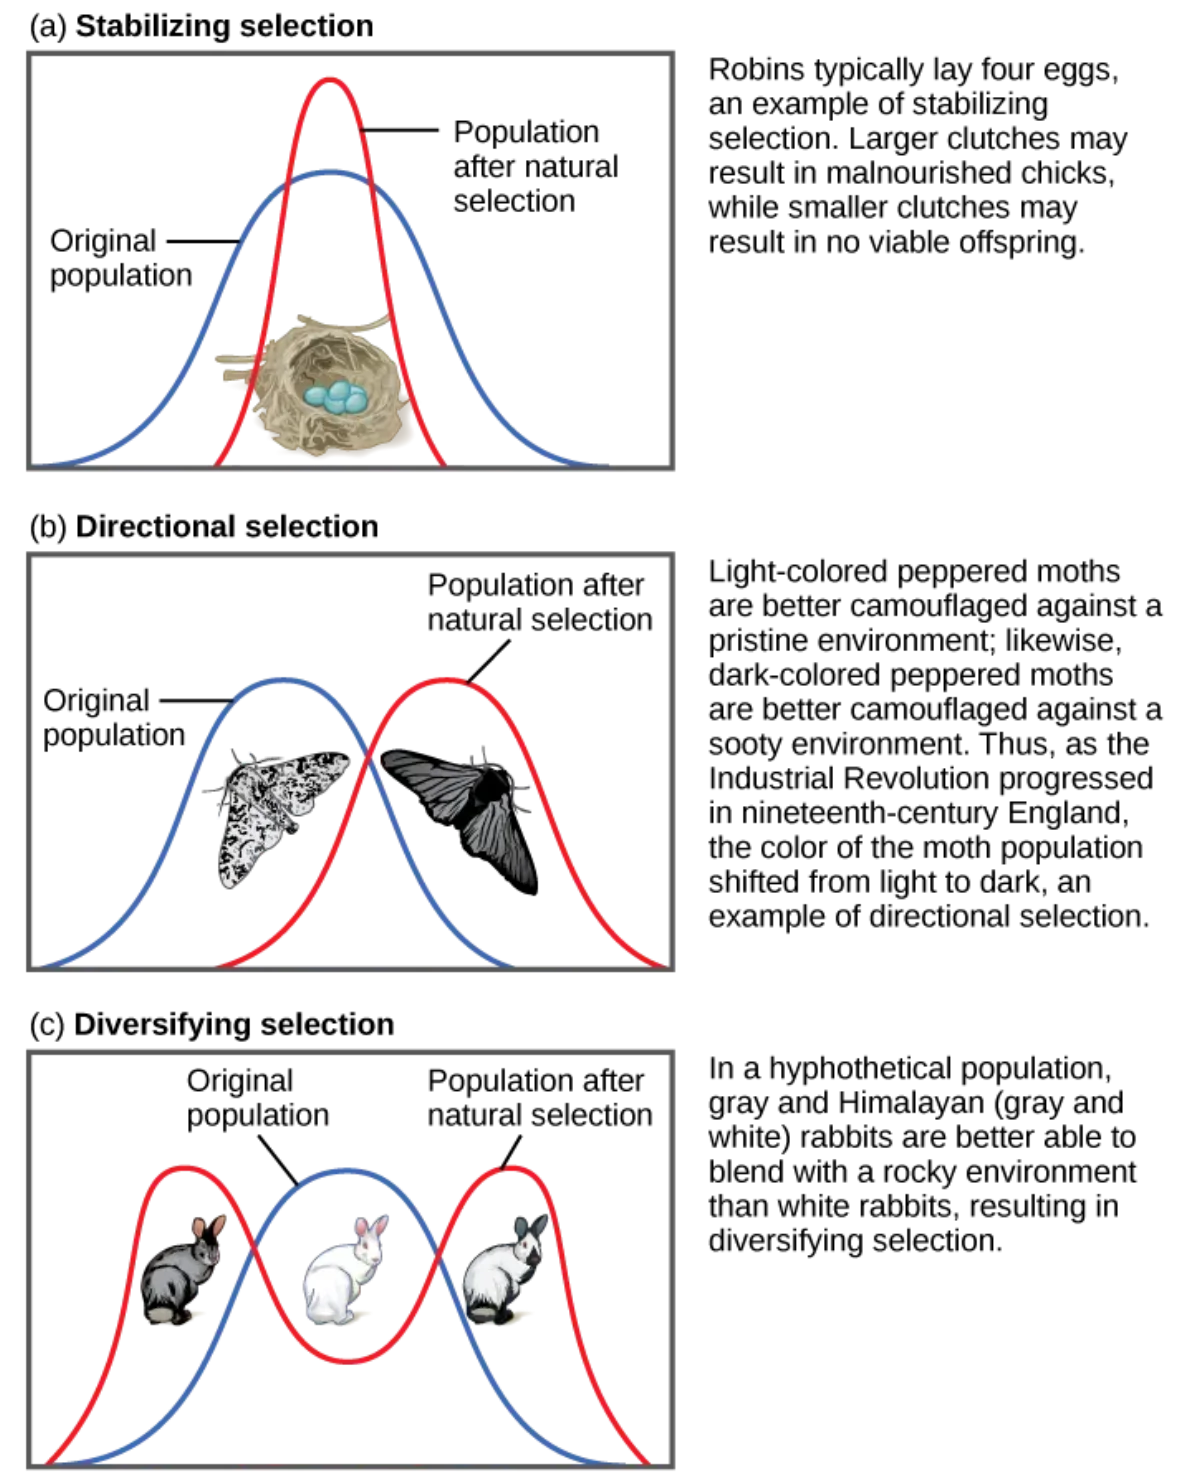
Stabilizing selection favors the average phenotype and selects against extremes. The bell curve becomes narrower. Example: human birth weight - babies that are too small or too large have lower survival rates.
Directional selection favors one extreme phenotype. The bell curve shifts in one direction. Example: antibiotic resistance in bacteria - the most resistant individuals survive, shifting the population toward higher resistance.
Disruptive (diversifying) selection favors both extremes and selects against the average. The bell curve splits into two peaks. Example: beak size in certain finch populations where medium beaks are less efficient than either very large or very small beaks.
The three types of natural selection and their effects on the phenotype distribution. Stabilizing narrows, directional shifts, and disruptive splits. Credit: OpenStax Biology 2e, CC BY 4.0
Sexual Selection
Sexual selection is selection driven by mate choice, not survival. Traits that improve reproductive access (bright plumage, antlers, courtship songs) can spread even when they make survival harder, because the fitness payoff comes from extra offspring. Peacock tails are the classic example: the tail is a metabolic burden, but it wins mates.
Two flavors show up in passages:
Intersexual selection: one sex (usually females) chooses mates based on a trait.
Intrasexual selection: members of one sex compete directly with each other for access to mates (e.g., males fighting for a harem).
Hardy-Weinberg Equilibrium
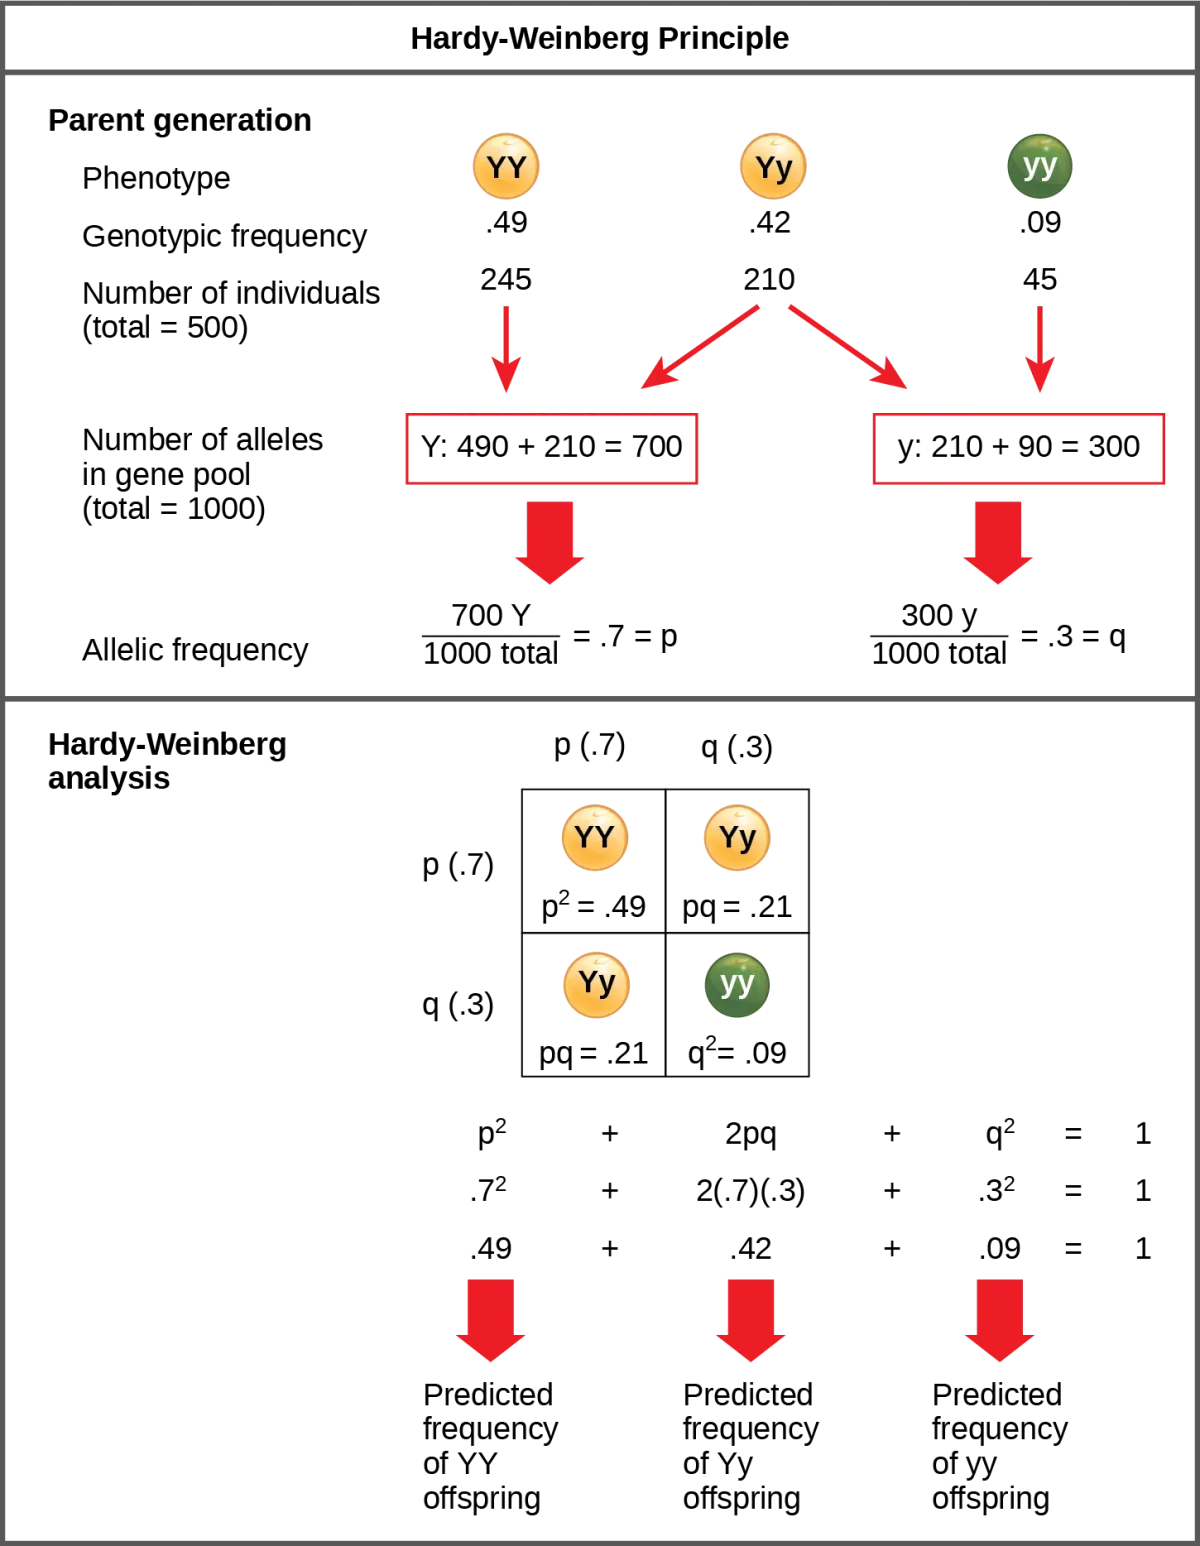
The Hardy-Weinberg principle describes a theoretical population where evolution is NOT occurring. It is the null hypothesis of population genetics. If a population is in Hardy-Weinberg equilibrium, allele frequencies remain constant from generation to generation.
Hardy-Weinberg equilibrium: allele frequencies remain constant across generations when no evolutionary forces are acting. Credit: OpenStax Biology 2e, CC BY 4.0
Five conditions must be met for Hardy-Weinberg equilibrium:
No mutation (no new alleles being created)
No natural selection (all genotypes are equally fit)
No gene flow (no migration into or out of the population)
Large population (no genetic drift)
Random mating (no sexual selection or assortative mating)
Using Hardy-Weinberg on the MCAT
The most common MCAT application: you are given the frequency of a recessive phenotype and asked to find carrier frequency.
Example: 1 in 2,500 people has cystic fibrosis (autosomal recessive).
Step 1: q2=1/2500, so q=1/50=0.02
Step 2: p = 1 - q = 1 - 0.02 = 0.98
Step 3: Carrier frequency (2pq) = 2(0.98)(0.02) = 0.0392, or approximately 1 in 25 people
Speciation
Speciation is the formation of new species. It occurs when populations become reproductively isolated - they can no longer interbreed to produce viable, fertile offspring.
Speciation is closely related to polymorphism - the existence of two or more distinct phenotypes in a population. Polymorphism provides the raw variation that speciation acts upon. For example, a polymorphic population of finches with large and small beaks may eventually split into two species if the intermediate beak size is selected against.
Allopatric speciation: Geographic separation (a river, mountain range, or migration to an island) divides a population. Over time, the isolated groups accumulate genetic differences until they can no longer interbreed even if reunited.
Sympatric speciation: A new species arises within the same geographic area, without physical separation. This can occur through polyploidy (common in plants - an organism gains an extra set of chromosomes) or habitat isolation (different groups within the same area specialize in different niches).
Reproductive Isolation Mechanisms
Type
When It Acts
Example
Temporal isolation
Pre-zygotic
Two species breed in different seasons
Habitat isolation
Pre-zygotic
Two species occupy different microhabitats
Behavioral isolation
Pre-zygotic
Different mating calls or courtship rituals
Mechanical isolation
Pre-zygotic
Reproductive organs are physically incompatible
Gametic isolation
Pre-zygotic
Sperm cannot fertilize the egg of another species
Hybrid inviability
Post-zygotic
Hybrid embryos fail to develop
Hybrid sterility
Post-zygotic
Hybrids are viable but infertile (e.g., mule)
Hybrid breakdown
Post-zygotic
F1 hybrids are fertile, but F2 offspring are weak or infertile
Adaptive Radiation
Adaptive radiation occurs when a single ancestral species rapidly diversifies into many species, each adapted to a different ecological niche. The classic example is Darwin’s finches on the Galapagos Islands - a single ancestor species diversified into over a dozen species with different beak shapes suited to different food sources.
Convergent vs Divergent Evolution
Divergent evolution: a single ancestor splits into lineages that become more different over time (Darwin’s finches, mammalian forelimbs). The shared structures are homologous - same embryonic origin, different function. Human arm, whale flipper, and bat wing all use the same bone plan.
Convergent evolution: unrelated lineages independently evolve similar traits because they face similar selective pressures. The shared structures are analogous - different embryonic origin, same function. Bird wings and insect wings both fly, but evolved from completely different tissues.
Phylogenetic Trees
A phylogenetic tree diagrams evolutionary relationships. Each branch point (node) is a common ancestor; each tip is a species. Two species are most closely related when their nearest shared node is the most recent, not when their tips happen to be drawn next to each other. Rotating a branch around a node does not change the relationships.
The Molecular Clock
A molecular clock uses the rate of neutral mutations to estimate how long ago two species diverged. The more DNA differences between two species, the longer ago they shared a common ancestor. The logic: neutral mutations are not filtered by selection, so they accumulate at a roughly constant rate.
Clocks are calibrated against the fossil record. Different genes tick at different rates - highly conserved genes (e.g., ribosomal RNA) are slow clocks good for deep splits, while less constrained genes (mitochondrial DNA) tick faster and resolve recent divergences.
In a population, 16% of individuals show the recessive phenotype. Assuming Hardy-Weinberg equilibrium, what is the frequency of heterozygous carriers?
Click to reveal answer
48%.q2=0.16, so q=0.4. p=1−0.4=0.6. Carrier frequency = 2pq=2(0.6)(0.4)=0.48 = 48%.
A population of beetles on an island is struck by a hurricane that kills 90% of the population. The surviving 10% happen to have a higher frequency of the green allele than the original population. What evolutionary mechanism is this?
Click to reveal answer
Genetic drift - specifically the bottleneck effect. A catastrophic event randomly reduced the population, and the survivors happen to have a non-representative allele distribution. The shift in allele frequency was due to chance, not natural selection (the green allele did not help them survive the hurricane).
What type of natural selection is occurring if the average birth weight in humans has remained remarkably stable over time, with very large and very small babies having lower survival rates?
Click to reveal answer
Stabilizing selection. The average phenotype (medium birth weight) is favored, while both extremes (too large or too small) are selected against. This narrows the phenotypic distribution around the mean.