
Titration Curves
A titration curve is a graph of pH versus the volume of titrant (acid or base) added. It tells you everything: the strength of the acid or base being titrated, the pKa, the equivalence point, and the buffer region. Reading titration curves quickly is one of the most tested skills in MCAT general chemistry.
The Anatomy of a Titration Curve
Every titration curve has these regions:
- Initial point - pH before any titrant is added
- Buffer region - the gradual rise (or fall) where both HA and A⁻ coexist
- Half-equivalence point - exactly halfway to the equivalence point, where [HA] = [A⁻] and pH = pKa
- Equivalence point - where moles of acid = moles of base (neutralization complete)
- Post-equivalence region - excess titrant dominates the pH
Strong Acid + Strong Base Titration
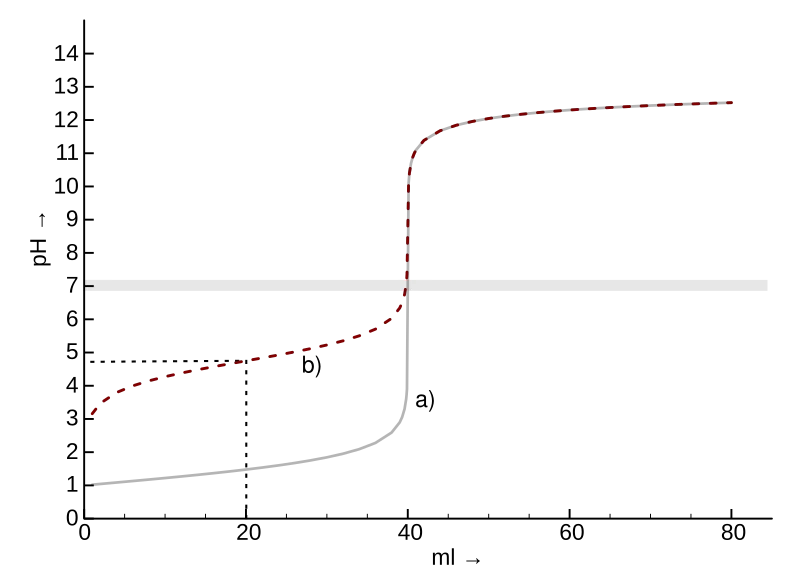
Example: Titrating HCl with NaOH
Key features:
- Initial pH: low (determined by [HCl])
- Equivalence point pH: exactly 7.0 (only water and a neutral salt remain)
- Curve shape: steep, dramatic jump centered at pH 7
- No buffer region (strong acids have no conjugate base that buffers)
At the equivalence point: moles HCl = moles NaOH. The solution contains only NaCl and water - both neutral.
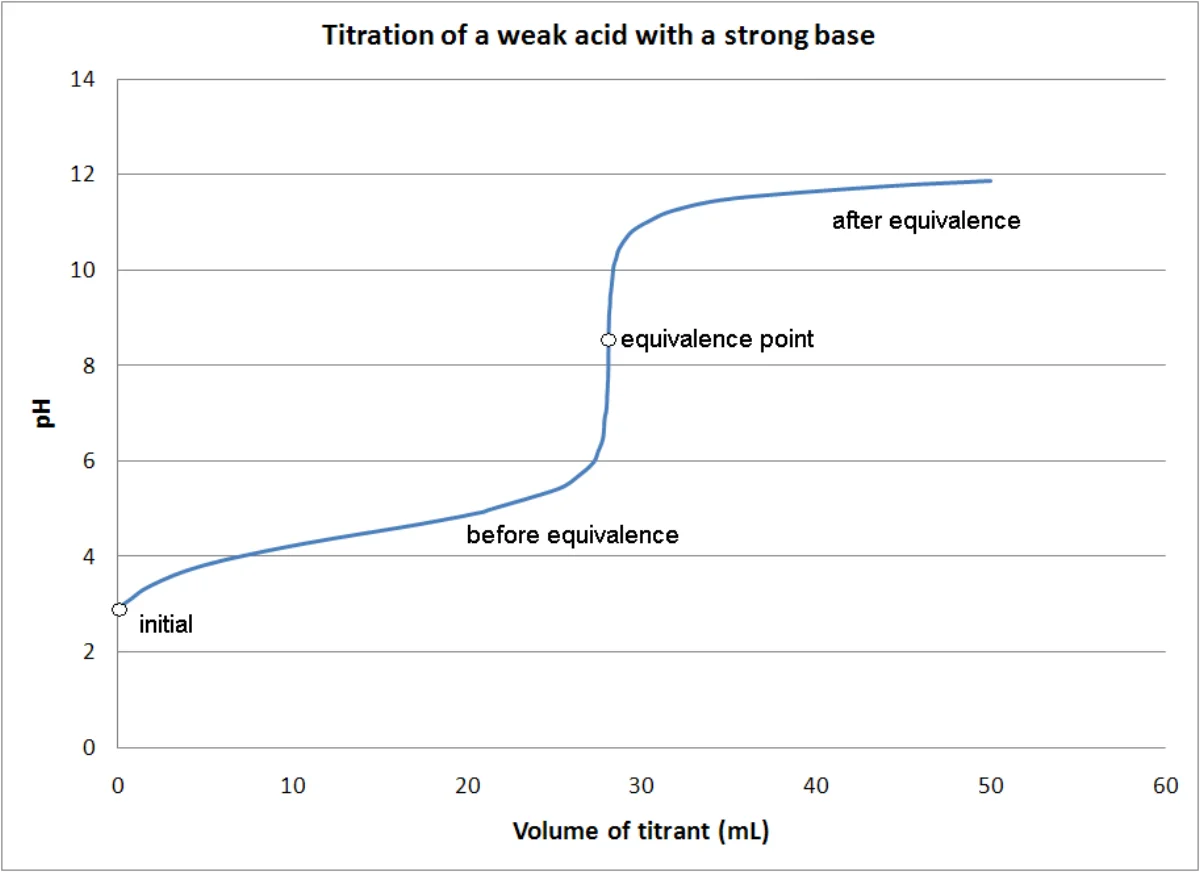
Weak Acid + Strong Base Titration
Example: Titrating CH₃COOH with NaOH
Key features:
- Initial pH: higher than the strong acid case (weak acid, less H⁺)
- Buffer region: the flat area before the equivalence point where both CH₃COOH and CH₃COO⁻ coexist
- Half-equivalence point: pH = pKa (this is how you find pKa experimentally)
- Equivalence point pH: above 7 (the solution contains only the conjugate base CH₃COO⁻, which is a weak base)
- Curve shape: gentler rise, equivalence point shifted above pH 7
Weak Base + Strong Acid Titration
Example: Titrating NH₃ with HCl
Key features:
- Initial pH: above 7 (basic solution)
- Buffer region: where both NH₃ and NH₄⁺ coexist
- Half-equivalence point: pOH = pKb, so pH = 14 - pKb = pKa of the conjugate acid
- Equivalence point pH: below 7 (the solution contains NH₄⁺, a weak acid)
- Curve shape: pH decreases as acid is added, steep drop at equivalence
Summary: Equivalence Point pH
| Titration Type | Equivalence Point pH | Why |
|---|---|---|
| Strong acid + strong base | Exactly 7 | Only neutral salt remains |
| Weak acid + strong base | Above 7 | Conjugate base of weak acid remains (basic) |
| Weak base + strong acid | Below 7 | Conjugate acid of weak base remains (acidic) |
| Weak acid + weak base | Depends on Ka vs. Kb | Compare Ka of conjugate acid to Kb of conjugate base |
Reading a Titration Curve on the MCAT
When you see a titration curve, extract this information immediately:
- Initial pH - read from the y-axis at volume = 0
- Equivalence point - the steepest part of the curve (the inflection point of the steep rise)
- Volume at equivalence - read from the x-axis at the equivalence point
- Half-equivalence volume - half of the equivalence volume
- pH at half-equivalence - this equals pKa (for weak acid titrated with strong base)
- pH at equivalence - above 7 (weak acid) or below 7 (weak base) or exactly 7 (strong-strong)
Calculating the Equivalence Point
At the equivalence point:
- moles of acid = moles of base
- x = x (for monoprotic acids and monobasic bases)
Solve for the unknown concentration or volume.
pH at the Equivalence Point of a Weak Acid Titration
At the equivalence point of a weak acid-strong base titration, all the HA has been converted to A⁻. The solution is equivalent to a solution of the sodium salt of the weak acid.
To find the pH: treat A⁻ as a weak base with Kb = Kw/Ka, and use [OH⁻] = √(Kb x c), where c is the concentration of A⁻ at the equivalence point (accounting for dilution).