If collision theory is the “bird’s-eye view” of reactions (molecules smashing into each other), transition state theory zooms in to show exactly what happens during the collision itself. It tracks the energy of the system as reactants transform into products, step by step.
The Transition State (Activated Complex)
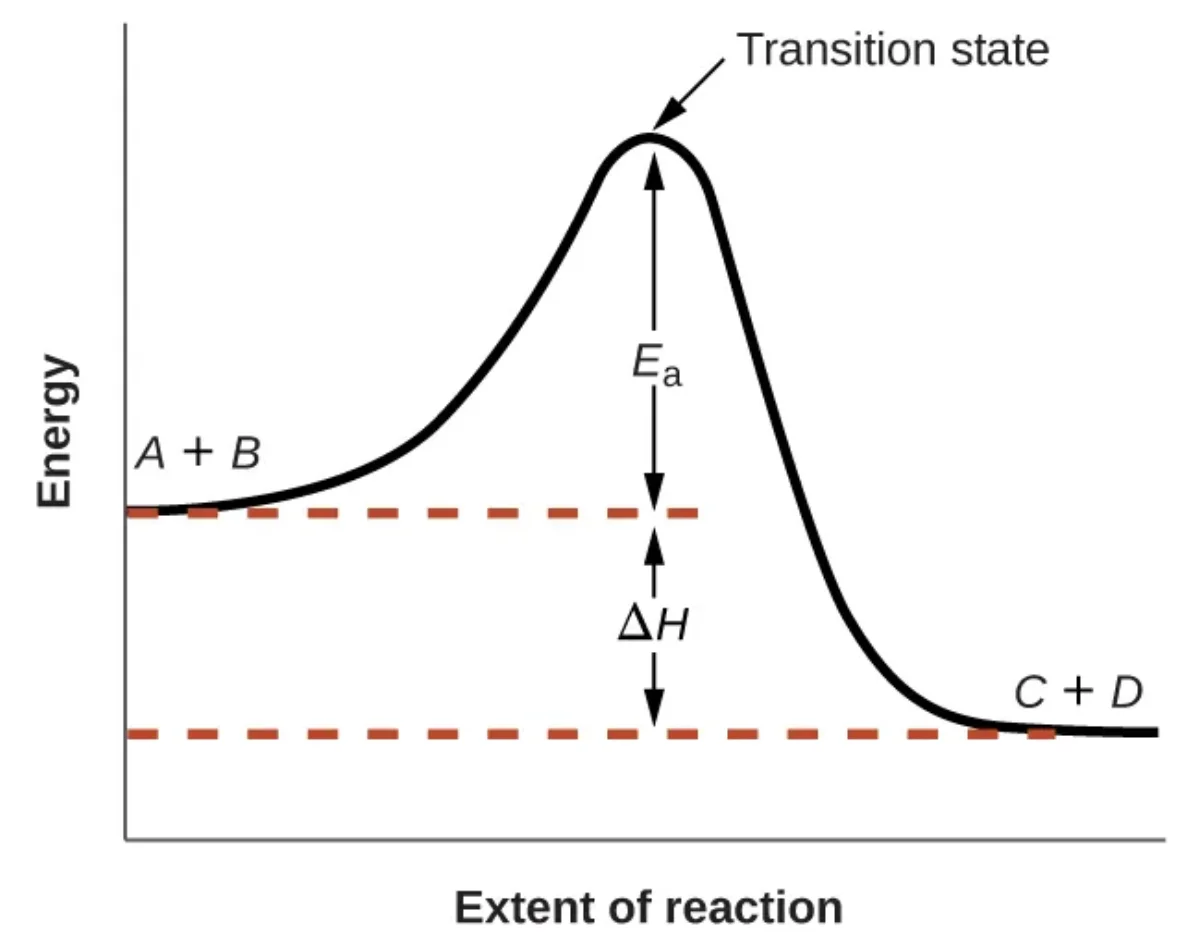
The transition state is the highest-energy point along the reaction pathway. At this point, old bonds are partially broken and new bonds are partially formed. The transition state is denoted by the symbol ‡ (double dagger).
Key properties of transition states:
They exist at the energy maximum on the reaction coordinate diagram
They are theoretical structures that cannot be isolated or observed directly
They have an extremely brief lifetime (on the order of femtoseconds)
Once formed, they can proceed forward to products OR fall back to reactants
Reading Reaction Coordinate Diagrams
A reaction coordinate diagram for an exothermic reaction. The peak represents the transition state, Ea is the activation energy, and ΔH is the enthalpy change. Credit: OpenStax Chemistry 2e, CC BY 4.0
A reaction coordinate diagram contains several important pieces of information:
Activation energy (Ea forward): The energy difference between the reactants and the transition state peak. This is the barrier the forward reaction must overcome.
Activation energy (Ea reverse): The energy difference between the products and the transition state peak. This is the barrier the reverse reaction must overcome.
Free energy of reaction (ΔG): The energy difference between products and reactants. This determines whether the reaction is exergonic or endergonic.
Exergonic vs. Endergonic Reactions
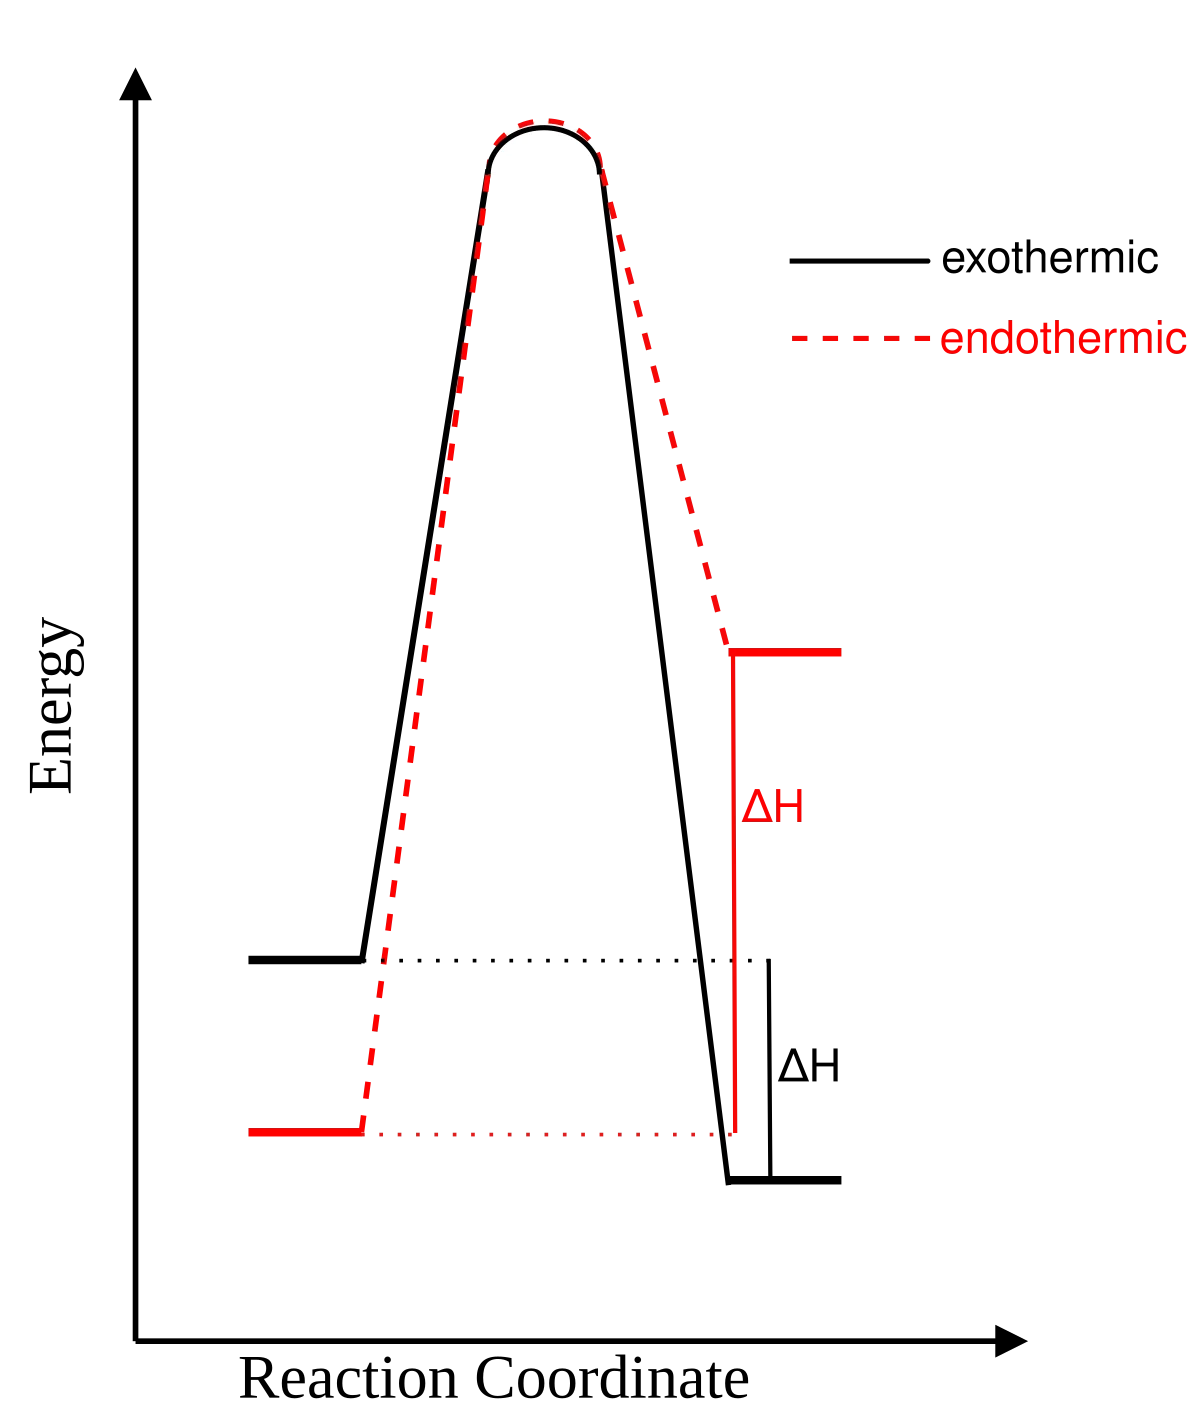
Exothermic reactions (black, solid) release energy: products are lower than reactants, ΔH is negative. Endothermic reactions (red, dashed) absorb energy: products are higher, ΔH is positive. Both must overcome the activation energy barrier at the transition state. Credit: Wikimedia Commons, CC BY-SA 3.0
Feature
Exergonic
Endergonic
ΔG
Negative
Positive
Products vs. Reactants
Products lower energy
Products higher energy
Spontaneous?
Yes (thermodynamically favored)
No (requires energy input)
Ea forward vs. Ea reverse
Ea forward < Ea reverse
Ea forward > Ea reverse
The Relationship Between Ea and ΔG
A critical concept: activation energy and ΔG are independent. A reaction can be exergonic (thermodynamically favorable) but still have a high activation energy (kinetically slow). Diamond converting to graphite is thermodynamically favorable but kinetically so slow that your engagement ring is safe.
On the diagram:
ΔG = Eproducts - Ereactants (where on the y-axis the reaction ends vs. starts)
Ea = Etransition state - Ereactants (how high you must climb)
Changing one does not automatically change the other. You can lower Ea (with a catalyst) without changing ΔG.
Intermediates vs. Transition States
For multi-step reactions, the reaction coordinate diagram has multiple peaks and valleys:
Feature
Transition State
Intermediate
Energy position
Local maximum (peak)
Local minimum (valley)
Can be isolated?
No
Sometimes (briefly)
Stability
Maximally unstable
Relatively more stable
Symbol
‡ (double dagger)
Usually written as a chemical formula
Appears in overall equation?
No
No
Lifetime
Femtoseconds
Longer (but still short)
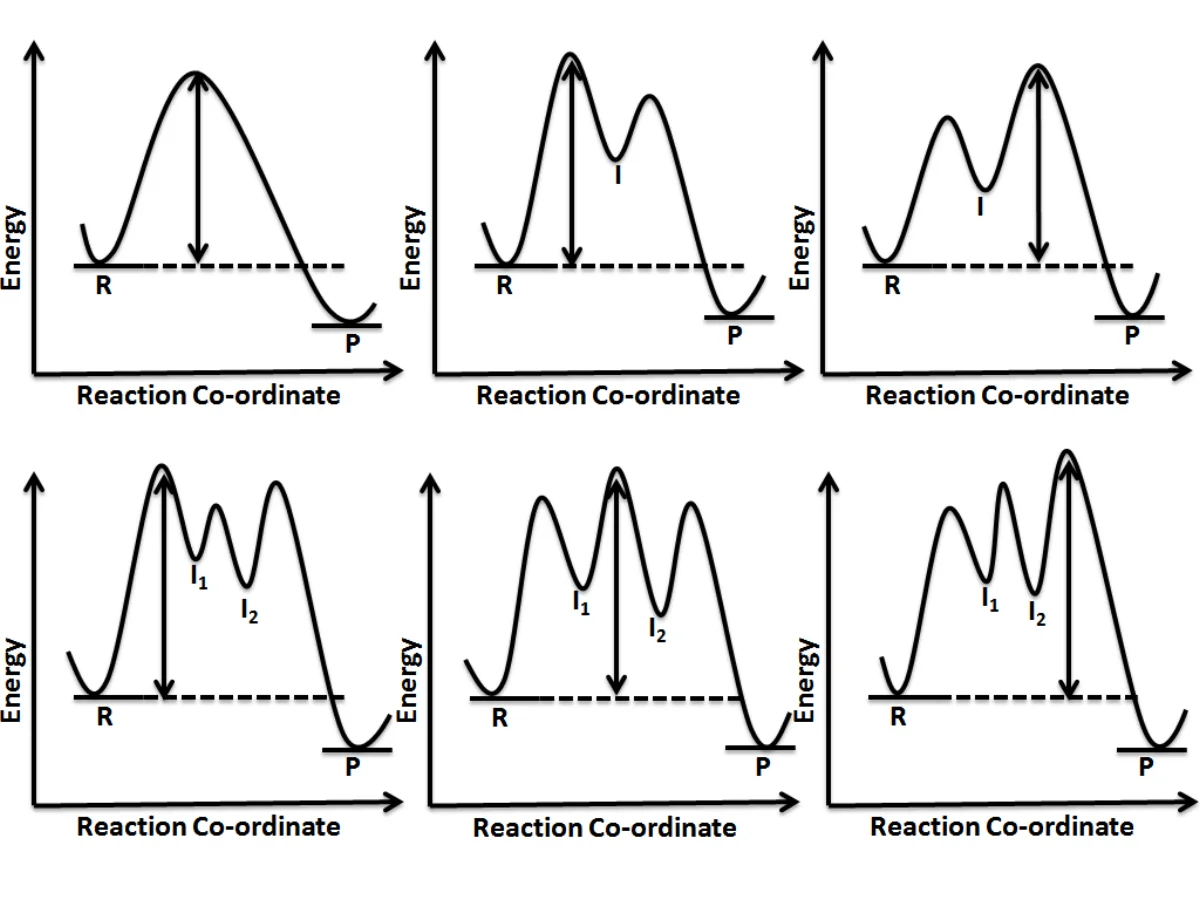
An intermediate sits in a valley between two peaks. It is a real molecule with a finite lifetime, formed after one elementary step and consumed in the next.
Reaction coordinate diagrams for multi-step mechanisms. Top row: one-step, two-step (with intermediate I), and two-step with a different rate-determining step. Bottom row: three-step mechanisms with two intermediates (I₁ and I₂). Peaks are transition states; valleys are intermediates. Credit: Wikimedia Commons, CC BY-SA 4.0
On a reaction coordinate diagram, what does the highest peak represent?
Click to reveal answer
The transition state of the rate-determining step. The highest peak has the largest activation energy barrier and corresponds to the slowest step in the mechanism. The rate of the overall reaction is determined by this step.
How do you distinguish an intermediate from a transition state on a reaction coordinate diagram?
Click to reveal answer
Intermediates are at local energy minima (valleys); transition states are at local energy maxima (peaks). Intermediates are real molecules that exist briefly between steps. Transition states are theoretical, highest-energy configurations that cannot be isolated.