
Maxwell-Boltzmann Distribution
Not all molecules in a gas sample move at the same speed. Some are barely crawling, some are zipping along at extreme velocities, and most are somewhere in between. The Maxwell-Boltzmann distribution describes exactly how molecular speeds are spread out in a gas sample, and it explains why raising the temperature makes reactions faster.
The Distribution Curve
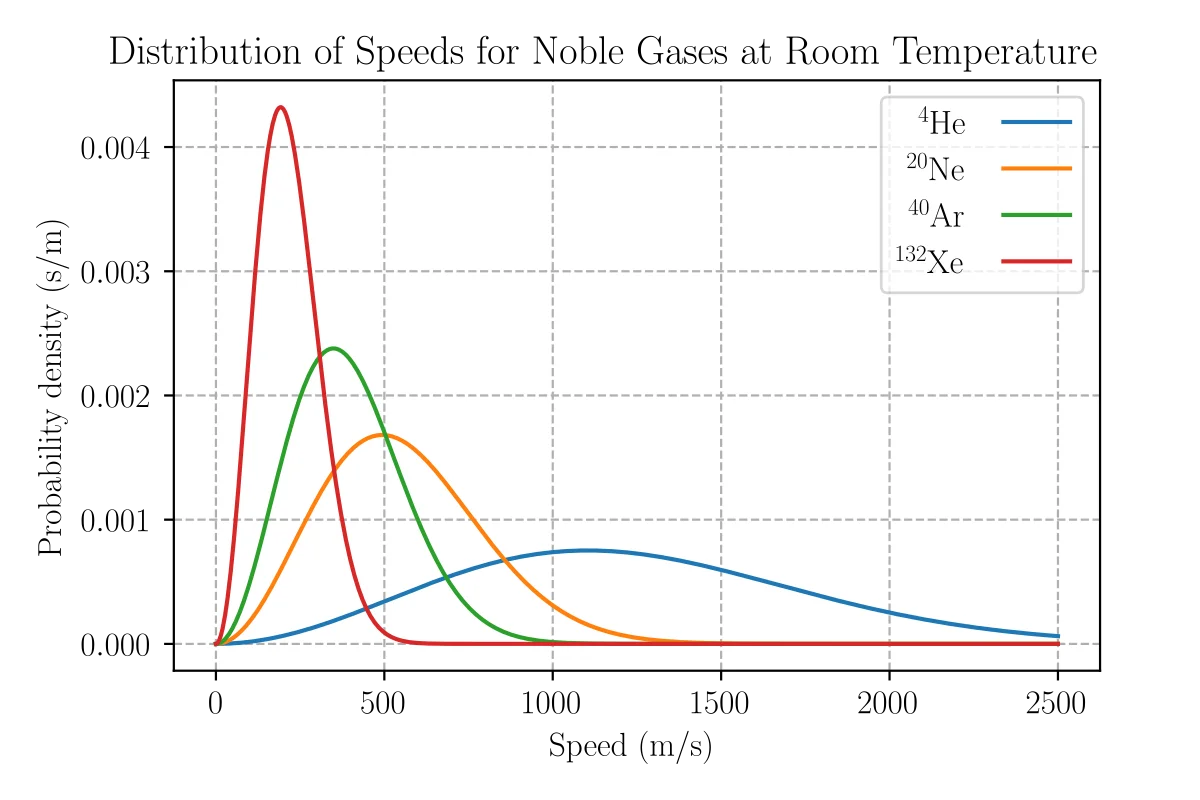
The Maxwell-Boltzmann distribution is a plot of “number of molecules” (y-axis) vs. “molecular speed” (x-axis). The curve:
- Starts at zero (no molecules have zero speed)
- Rises to a peak at the most probable speed
- Has a long tail extending to the right (a few molecules move very fast)
- Is asymmetric - the tail always extends further to the right than the left
Three Measures of Speed
The distribution defines three characteristic speeds, all slightly different:
| Speed | Definition | Relative Magnitude |
|---|---|---|
| Most probable (v(mp)) | Speed at the peak of the curve | Smallest |
| Average (v(avg)) | Arithmetic mean of all speeds | Middle |
| Root mean square (v(rms)) | sqrt of the mean of v² | Largest |
The order is always: v(mp) < v(avg) < v(rms). For MCAT purposes, you mainly need to know v(rms) = sqrt(3RT/M) and that these three speeds are close to each other.
Effect of Temperature
Increasing temperature changes the Maxwell-Boltzmann curve in three ways:
- The peak shifts to the right (higher most probable speed)
- The peak gets shorter (fewer molecules at the most probable speed)
- The curve broadens (wider range of speeds)
The total area under the curve stays the same (same number of molecules), but the distribution flattens out and shifts toward higher speeds. This means that at higher temperatures, a larger fraction of molecules exceed any given speed threshold - including the activation energy threshold for a chemical reaction.
Effect of Molar Mass
At the same temperature, lighter gases have:
- A peak shifted further to the right (higher speeds)
- A broader, flatter distribution
- Higher v(rms) values
Heavier gases have a narrower, taller curve centered at lower speeds. Both have the same average kinetic energy (same temperature), but the lighter gas converts that energy into more speed because KE = mv².
Temperature vs. Molar Mass Effects - Summary
| Change | Effect on Speed Distribution |
|---|---|
| Increase T (same gas) | Peak shifts right, curve broadens and flattens |
| Decrease T (same gas) | Peak shifts left, curve narrows and gets taller |
| Lighter gas (same T) | Peak shifts right, curve broadens and flattens |
| Heavier gas (same T) | Peak shifts left, curve narrows and gets taller |
Notice that increasing temperature and decreasing molar mass have the same qualitative effect on the distribution. Both shift the curve to higher speeds.