
ECG Basics
An electrocardiogram (ECG or EKG) is a recording of the heart’s electrical activity detected by electrodes placed on the skin. It does not measure contraction directly - it measures the electrical events that trigger contraction. Think of it as listening to the commands, not watching the soldiers march.
The MCAT expects you to know what each wave represents and to reason through how changes in conduction would alter the tracing. You will not be asked to diagnose specific arrhythmias, but you may see an abnormal ECG described in a passage and need to connect it to the underlying physiology.
The Normal ECG Tracing
A single heartbeat produces three recognizable waveforms:
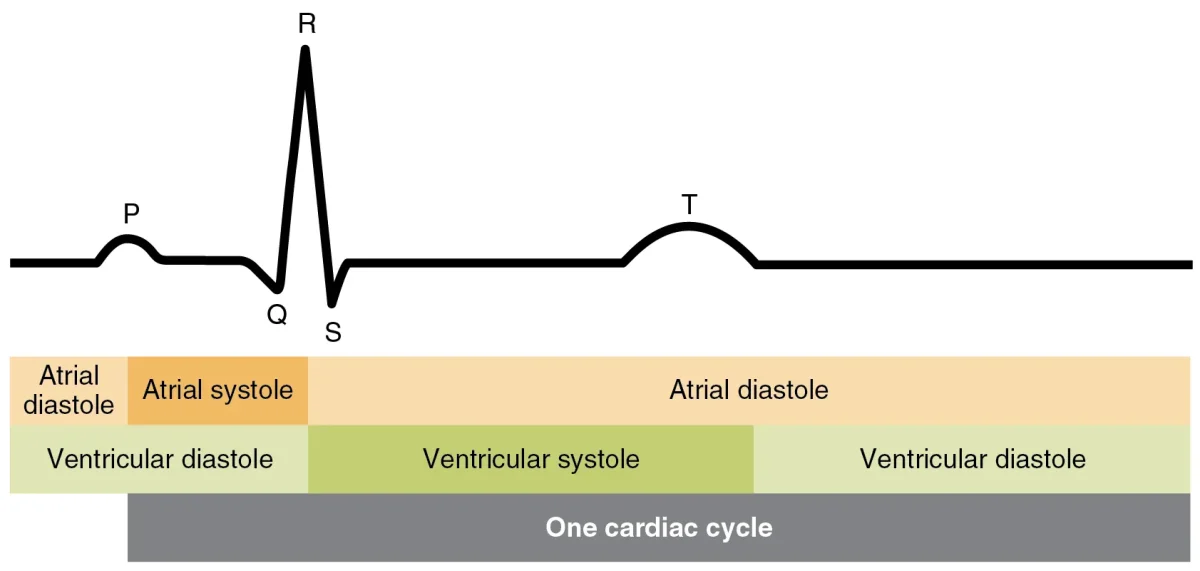
| Wave/Segment | Electrical Event | Mechanical Event |
|---|---|---|
| P wave | Atrial depolarization | Atria contract (atrial systole) |
| PR interval | Impulse travels through AV node (delay) | Ventricles finish filling |
| QRS complex | Ventricular depolarization | Ventricles contract (ventricular systole) |
| ST segment | Ventricles fully depolarized (plateau phase) | Blood being ejected |
| T wave | Ventricular repolarization | Ventricles begin to relax |
Key Points for the MCAT
Why is the QRS complex larger than the P wave? The ventricles have much more muscle mass than the atria, so ventricular depolarization produces a much larger electrical signal.
Where is atrial repolarization? It occurs during the QRS complex but is completely masked by the much stronger ventricular depolarization signal. You cannot see it on a normal ECG.
What does the PR interval represent? The time from the beginning of atrial depolarization to the beginning of ventricular depolarization - essentially, the AV node delay. If the AV node conducts slowly, the PR interval lengthens.
What does the QT interval represent? The time from the start of ventricular depolarization to the end of ventricular repolarization - the total duration of ventricular electrical activity.
Connecting the ECG to the Conduction System
Each part of the ECG tracing maps directly to the conduction pathway you learned in the previous section:
- P wave = SA node fires, impulse spreads across atria
- PR interval (flat line) = impulse pauses at the AV node (the critical delay that lets atria finish emptying)
- QRS complex = impulse travels through Bundle of His and Purkinje fibers, depolarizing the ventricles
- T wave = ventricles repolarize and prepare for the next cycle
If any part of the conduction system fails - for example, the AV node stops conducting - the relationship between these waves changes. A passage might describe P waves and QRS complexes occurring at different rates or with abnormal spacing. Your job is to identify which part of the conduction pathway is affected based on what you know about each wave.